
Protecting Children Online
The internet can be a place where children access incredible tools for connection, learning, and creativity. But it also presents a host of dangers: i…
Read
POLICY CIRCLE BRIEF
Even in its conception, the United States has never been debt-free. Notably, the debt ratio has steadily increased in recent years, affecting the federal budget (and the services it has pledged to offer), international relations, the currency, and economic activity. The ratio decreases when the Gross Domestic Product (GDP) grows and increases when the government borrows money. When experts talk about the debt decreasing, they usually mean the ratio of debt to GDP, not the actual amount borrowed.
The government follows a cyclical pattern—when GDP increases, there is little reason to borrow since the budget should be well-financed. This decreases the ratio, but it does not necessarily mean the actual amount of debt is decreasing. When there is a recession, the government increases spending above its revenue, creating a deficit that requires borrowed funds. This will increase the ratio of debt to GDP.
As the Congressional Budget Office (CBO) notes, the federal debt held by the public reached 97% of the GDP at the end of 2023 (the latest measure as of March 2024). This marked the highest ratio since 1950, and the ratio has only continued its upward trajectory. In Q2 2020, the debt reached 103% of GDP. In Q2 of 2024, it was at approx. 120%. The projected debt growth would dampen economic activity over time and pose significant risks to future fiscal and economic conditions.
The federal debt is growing every day. Data from the U.S. Treasury Department shows its current amount: In 2024, it passed $35 trillion.
For the fiscal year 2022, the U.S. Government Accountability Office reported that $247 billion was paid in error. This went down in 2023 to $236 billion. Over the last twenty years, that amount has totaled to $2.4 trillion. Just a few years ago, an audit by the Office of the Inspector General revealed the Social Security Administration (SSA) in 2018 miscalculated beneficiaries’ income by nearly $1 billion and made $8 billion worth of improper payments. Part of the reason? Outdated technology. What does this misuse of funds look like for average citizens?
For Margaret Fitzwater of Cincinnati, Ohio, a letter from the Social Security Administration (SSA) in 2014 claimed that she had been overpaid by $27,000. In December 2018, 53 months later, Fitzwater finally got a hearing on her case, in which a judge determined she still owed the agency $30,000. In Connecticut, Bill and Bess Small, both 85, received similar notifications in March 2019. After two decades of overpayments and just after Bess was diagnosed with dementia, the SSA demanded the couple repay the total overpayment of more than $38,000. The agency admitted the couple were blameless but denied the couple’s request that the demand for repayment be waived.
Taxpayers suffer the consequences of improper payments. Little by little, the combination of mandatory government spending and the mismanagement of taxpayer money contributes to the country’s debt and the struggles of its citizens.
As the national debt increases, the likelihood that the government cannot pay a debt increases, which means treasury securities (bills, notes, and bonds through which citizens and non-citizens essentially lend money to the government) are riskier investments. When fewer people are willing to invest in government securities, there is also a risk of reduced economic growth, which can negatively impact household income.
Some economists say the debt should be sustainable as long as interest rates remain low and note investors aren’t worried about the debt and continue to borrow. As interest rates rise, it will become more expensive for the government to borrow money because it will have to pay higher interest rates on the debt; relative to the size of the economy, required interest payments on the debt are projected to triple by 2050. Others argue that debts we accrue now will just need to be paid later, likely in the form of reduced benefits and services. The federal debt and federal deficit have impacts all Americans can feel.
The federal debt has officially exceeded $35 trillion. The Peter G. Peterson Foundation has provided some sobering statistics on this staggering number:
While manageable levels of debt are expected, the magnitude and ratio of the federal debt have been increasing dramatically.
Federal Deficit: The amount by which government spending exceeds the revenue it takes in each year. In other words, the deficit represents one year’s worth of “borrowing” by the federal government.
Federal/National Debt: The “net accumulation of budget deficits,” or the total amount of money the U.S. government has borrowed. This includes public debt, when the public, the Federal Reserve, or foreign governments buy bills, notes, and bonds issued by the Treasury; and intragovernmental debt, which is money borrowed from one arm of the government to another, such as money from trust funds that are used to pay for programs like Social Security and Medicare.
Discretionary Spending: Determined through annual appropriation acts authorized by Congress. Several federal programs, including defense, education, and transportation programs, rely on the annual appropriation acts from the House and Senate Appropriations Committees. This money is considered “discretionary” because it is not what must be paid annually but what Congress chooses to spend.
Mandatory Spending: This kind of spending does not normally rely on annual appropriation acts but is dependent on legislation. This means mandatory spending is “essentially on ‘autopilot’ unless policymakers change the laws governing the program.” Mandatory spending includes entitlement programs for Social Security, Medicare, and Medicaid, as well as smaller programs that involve payments to people and businesses (unemployment compensation, student loans, and retirement programs for federal employees and veterans).
The U.S. has been borrowing money since before it was a sovereign nation when colonial leaders borrowed from France and the Netherlands to win independence from Great Britain during the Revolutionary War. This created quite a dilemma – the Continental Congress did not have the power to tax citizens, and no taxes meant no revenue to pay off the debt. By the end of 1790, the debt stood at $75 million (about $2.5 billion in today’s dollars). The economy was just starting and growing, which helped decrease the debt ratio until the U.S. needed to borrow money to fight Britain again in the War of 1812.
In 1828, the debt was $58 million ($1.5 billion today). President Andrew Jackson referred to it as the “national curse,” selling off federally-owned land and cutting the budget to help reduce the debt. He paid off all the interest-bearing debt for the first and only time in United States history. The debt exploded again shortly after during the Civil War.
The Government Accountability Office (GAO) projected that the debt ratio to GDP will be 200% by 2050, or twice as much as the GDP. The slope is so sharp because as the ratio increases, so does the interest.
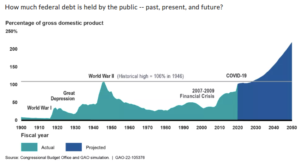
The federal, or public, debt has fluctuated over the years. At the end of 2007, federal debt held by the public only stood at about 35% of GDP. The deficits from the bank bailouts and billions of dollars of fiscal stimulus during the Great Recession caused the ratio to double by the end of 2012. Even after the recovery from the recession, the public debt-to-GDP ratio continued to climb to 78% by the end of 2019. Borrowing increased greatly during the COVID-19 pandemic to fund stimulus projects, increasing the debt ratio to a peak of 132% in Q2 of 2020, coinciding with a dip in the GDP.Economic activity grew, the GDP recovered, and the debt ratio returned to just under 100% in mid-2022.
In 2024, the total U.S. debt passed $35 trillion. The debt-to-GDP ratio is sitting at 120%.
The federal budget deficit has similarly increased in recent years. In 2009, spending cuts and a recovering economy boosted government revenue and shrunk deficits. However, in September 2016, the budget deficit increased for the first time in five years to $587 billion due to increases in spending, higher interest rates on debt, and the growing number of Medicare, Medicaid, and Social Security recipients.

In FY2021, federal spending was even higher at $6.82 trillion, but revenues increased to $4.05, leaving a deficit of $2.77 trillion. Similarly, in FY2022, the federal government collected just over $5 trillion in revenue and spent $6.3 trillion, leaving a deficit of $1.4 trillion. This was over triple the 2019 deficit and more than double the previous record of $1.416 trillion spent in 2009. It was the result of increases in spending from healthcare costs, stimulus checks, unemployment compensation, and business rescue programs prompted by the coronavirus pandemic.
It took 204 years for our country to get to $1 trillion of national debt when it crossed that marker in 1983. It has grown to $9 trillion in debt in the last decade. The debt is at a record high, and current projections show the debt exploding over the coming years.
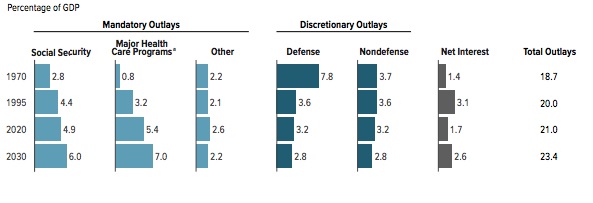
Mandatory spending has taken up a larger chunk of the federal budget over time. The first expansion came with the Social Security Act of 1935, followed by the Medicare Act of 1965 that enacted Medicare and Medicaid. In 1962, before the healthcare programs, less than 30% of all federal spending was mandatory.
In 2022, mandatory spending amounted to $4.1 trillion, about 70% of total government spending and 17% of GDP. Between 2002 and 2021, mandatory spending outlays averaged 12.9% of GDP; increased spending in response to the coronavirus pandemic significantly impacted this.
Meanwhile, discretionary outlays in 2022 shrunk, as evidenced in the Congressional Budget Office chart below. Discretionary spending averaged about 7% of GDP between 2002 and 2021 and jumped slightly to 7.8% in 2020.
In 2023, mandatory spending was down to $3.8 trillion, and discretionary spending was at $1.7 trillion.
Khan Academy further explains how these two spending sources have essentially switched regarding total government spending in the last 50 years.
What role the government should play in managing the debt is contested. Some policymakers emphasize this problem less, while some see the debt as a dangerous symptom of out-of-control spending. Those who view the debt as a severe problem tend to fall into two lines of thought: seek spending restraint and new rules to enforce it, or expand the federal government’s power by raising taxes and imposing controls on the industries contributing most, such as healthcare.
Congress, particularly the House of Representatives, holds the “power of the purse,” overseeing taxes and allocating public money for the national government.
For every fiscal year, Congress must produce a budget resolution that sets the total amount of discretionary funding (which covers areas from defense and law enforcement to foreign aid and disaster relief) for that fiscal year. The House and Senate Committees on Appropriations are then responsible for separate appropriation bills for determining program-by-program funding. Mandatory spending for Medicare and Social Security programs is not part of the appropriations process. It is automatic unless Congress alters underlying legislation; funding is based on parameters like eligibility and benefit formulas.
In addition to relying on revenues from taxes to fund its operations, the federal government borrows money and issues bonds. When the government borrows, “it borrows from people and businesses whose savings would otherwise finance private investment in productive capital…national saving, or the amount of domestic resources available for private investment, therefore declines” (CBO). This means borrowing can be counterproductive, as a more robust economy generates more economic activity and growth, and therefore the government has more to tax. This is why the economic recovery in 2009 tremendously affected deficit reduction. The increased revenue for the government, combined with a lower demand for government services like unemployment assistance and other safety-net programs, helped to reduce the deficit.
The federal government issues debt through Treasury bonds purchased by individual investors, foreign nations, and the federal government. The Federal Reserve is currently the largest debt holder. Foreign investors hold about a third of the total – Japan is the largest holder at over $1 trillion.
See which countries hold the most Treasury securities here.
The debt ceiling or limit “is the legal limit on the total amount of federal debt the government can accrue.” The debt ceiling was originally enacted in 1917 (during WWI) at $11.5 billion and has since been increased by Congress and the president nearly 100 times. It increased from less than $1 trillion to $31.4 trillion in 2021. The debt limit is suspended until January 1st, 2025, at which point the amount of outstanding debt will become the new limit.
Debt ceilings mean the government is not allowed to issue any new debt. Since our federal government spending has significantly exceeded revenues in past years, it constantly needs to increase the debt ceiling further. Hitting the debt ceiling would mean at least a temporary default on obligations ranging from Social Security payments to veterans’ benefits. Defaulting would send domestic and international markets into economic chaos because the U.S. would no longer be a safe investment.
The current options to address the deficit are a government shutdown, spending increases, or budget cuts. In response to the deficit, Congress consistently increases spending and the debt ceiling. Brian Riedl, Senior Fellow at the Manhattan Institute, explains that having a penalty default is important but can easily backfire: “If the penalty is too weak, it will not motivate lawmakers to overcome their strategic disagreement. If the penalty is too strong, the parties are more likely to repeal its enforcement without adding a deficit-reduction deal.”
This is key to understanding debts and deficits: reports on the 2017 Tax Cuts and Jobs Act reveal government revenue actually increased by 2% in the first seven months of FY 2019. However, federal spending increased by 7% during that period. Outlays in Social Security benefits, Medicare, and Medicaid all increased, dwarfing the revenue increases and reminding us that our nation’s deficits and debt will continue to rise without reigning in spending.
No Labels breaks this down further (2 min):
Changing demographics of an aging population, increasing healthcare costs, and rapidly growing interest payments are the main drivers of U.S. debt. The majority of the government’s annual spending goes toward mandatory spending in the form of entitlement programs like Social Security and Medicare. Without major reforms to these programs, our deficits and debt are expected to continue their upward trajectory.
USA Facts also breaks down government revenue and expenditures in this visualization.
The non-partisan Peter G. Peterson Foundation, which seeks to increase public awareness of America’s pressing fiscal challenges, noted that, because of increases in life expectancy and the aging population of Baby Boomers, “the number of people age 85 and older is expected to triple over the next 30 years.” This also means growth in the entitlement programs (Social Security, Medicare, and Medicaid) that serve this specific group and play a key role in inflating the debt.
America’s aging population accounts for practically all the predicted spending growth in Social Security. Social Security is the single largest program in the federal budget. The CBO predicted in 2023 that the gap between funds in the account and the amount that is due to eligible individuals will keep growing. This will mean that either benefits will need to be adjusted or funding will need to be drawn from other sources.

The problem is that the programs’ trust funds’ revenues are projected to grow more slowly than expenditures, meaning an eventual deficit. It is estimated that the trust fund for social security will be depleted by 2035. Slowed population growth, low mortality rates, higher inflation, and reduced payroll tax revenue have all impacted the trust fund. For more, see The Policy Circle’s Safety Net Programs Brief.
Every five years, the National Health Statistics Group conducts an in-depth review of the National Health Expenditure Accounts (NHEA). The last time this review was conducted was in 2022 – they found that the U.S. spent $1.9 trillion, or 29% of GDP, on healthcare, which is only predicted to grow. Healthcare spending includes Medicare, Medicaid, the Children’s Health Insurance Program (CHIP), and Affordable Care Act subsidies. Medicare alone accounts for over 20% of all national health spending. As the population ages, more Americans will qualify for federal healthcare programs, which are already straining against fiscal challenges. The growing cost of healthcare per person accounts for two-thirds of predicted spending growth.
As the population ages, more Americans will qualify for federal healthcare programs, which are already straining against fiscal challenges. The U.S. spends far more on healthcare per capita than other advanced countries but does not see better results. Without reforms, these programs – and their budgets – will continue to grow unchecked to bear the increased cost of supporting more people who will also likely require more health care as they age.
Experts have long pointed to the system’s improper payments or fiscal waste. Estimates of the total waste range from $600 billion to almost $2 trillion, or 17%-53% of the $3.6 trillion spent annually on healthcare. This provides many opportunities to lower costs. Alternative payment arrangements and more visibility in healthcare costs are common reform ideas that go beyond simply clamping down on costs, which would risk shifting costs to other parts of the healthcare system and making access to healthcare more difficult for intended beneficiaries. For more on reform options, see The Policy Circle’s Healthcare Brief.
The Manhattan Institute’s Brian Riedl breaks down these two main drivers (5 min):
The CBO estimates that interest payments in 2024 amounted to $892 billion. As a percent of GDP, interest payments are projected to double between 2021 and 2031. The Federal Reserve has been keeping interest rates low in response to the coronavirus pandemic, but inflation pressures are prompting the Fed to consider raising rates. By 2049, interest costs are predicted to be twice as much as the average government spending on research and development, infrastructure, and education combined. Projected borrowing will also increase interest. Many foreign investors hold Treasury securities. Increasing interest outlays then increases payments to foreign investors while reducing household income.
The vast amounts of money that come from entitlement programs and discretionary spending – the kinds of spending that are planned for – can sometimes dwarf the spending that is not planned for. But this does not diminish its importance. Improper payments are “payments made by the government to the wrong person, in the wrong amount, or for the wrong reason.” These can stem from an inability to access or verify data that could help determine whether recipients should receive payment, including death data or financial data. Mistakes in inputting, classifying, or processing data can also lead to improper payments. It is estimated that the total cost of improper payments in FY2023 was $236 billion. Too many large programs are difficult to manage and keep track of and can result in spending excesses. See The Policy Circle’s Poverty Brief for more on these programs. Also see The Policy Circle’s Taxes Brief for more on improper payments.
Besides improper payments, general waste is also a little-known but large problem, particularly in year-end waste when the federal government goes on a “use-it-or-lose-it year-end spending spree” because agencies know that if they leave significant balances in their accounts at the end of the fiscal year, Congress may reduce their budget in the future.
Similar to the 2008-2010 stimulus legislation to recover from the Great Recession, but on a much larger scale, the federal government put together a series of relief bills in March 2020 to combat the economic fallout of the coronavirus pandemic. The three pieces of legislation, including the $2 trillion Coronavirus Aid, Relief, and Economic Security (CARES) Act, are meant to provide billions of dollars in credit for struggling industries, public health support, direct cash payments to Americans, and a significant boost to unemployment insurance. Even with $2 trillion already committed, lawmakers are still considering taking action on a fourth phase of legislation.
The federal government ended FY2020 with a deficit of $3.1 trillion, more than triple the FY2019 deficit. The COVID-19 pandemic created the need to increase spending. It became a priority to address the current needs of the economy – small businesses were struggling to stay afloat as social distancing affected their operations. Many people lost their jobs because they could not be done remotely. The federal government funded several relief measures that are in place until 2025.
Generally speaking, there are various methods a government can use to attempt to reduce debt, but none are without controversy. Some examples that governments have used in the past include the following:
Governments from the United States to the European Union have all kept interest rates low to help their economies in the past. When interest rates are low, people and businesses can easily borrow money to spend on goods and services that generate jobs and tax revenue to stimulate the economy. In recent years, “persistently low interest rates have provided a fiscal cushion of the U.S. and kept the deficit from growing even faster.”
After the COVID-19 pandemic, the federal interest rate increased sharply in order to combat inflation. It plateaued in September 2023 until the Federal Reserve began lowering it a year later in September 2024. Interest rates are expected to continue to decrease as the economy recovers and activity increases.
Nations can also rely on increases in exports and production to reduce their debt burdens, as focusing on trade can also contribute to economic growth. Between 2003 and 2010, for example, Saudi Arabia’s oil production and exports helped reduce its debt from 80% of GDP to just over 10% of GDP. In the United States, exports have been steadily increasing, with one noticeable dip in 2020 that was followed by substantial increases quarter over quarter.
Bailouts and defaults are more drastic measures regarding debts and deficits. A bailout entails debt forgiveness. Jacob Goldstein, host of the podcast Planet Money, says a bailout gives a country “time to get its act together, start growing again, and pay down its debt.” The European Union did this during the global financial crisis when it bailed out Greece, Ireland, and Portugal by lending them more money. However, in the long term, deeper economic troubles can make such loans a bad idea.
When a country can’t repay, it ends up defaulting. Defaulting on a debt includes missing or delaying a payment or restructuring payments to creditors. This happened to Greece: the International Monetary Fund (IMF) and the EU contributed to the country’s bailouts in 2010 and 2012, but its debt was too deep for the loans to make a sustainable difference. In 2015, Greece became the first developed country to default to the IMF, which led to a third bailout for the country that year. Russia, Argentina, and Pakistan have all defaulted on loans since the 2000s. Defaulting impacts current investors and does little to boost confidence for future investments, which can mean high borrowing costs for that country. For example, Argentina missed bond payments in the early 2000s, and over 10 years later, interest rates on its bonds were still 12 percentage points higher than those of the U.S. Treasury.
Mistakes happen, and improper payments do not necessarily mean fraud or a loss to the government. However, they “degrade the integrity of government programs and compromise citizens’ trust in the government.” Since all government revenue comes from its citizens, such extraneous spending does come out of paychecks. Putting an end to improper payments and conducting oversight can help reign in spending. End-of-year fiscal responsibility acts that would prevent federal agencies from “spending more in each of the last 2 months of a fiscal year than the agency’s average monthly spending for the previous 10 months” were introduced in both the House and the Senate in 2019. Targeting programs that lack federal mandates and having the Government Accountability Office “report overlap, duplication, and fragmentation in Federal programs” are other potential sources of oversight. A new spending oversight bill is set to be reviewed by the Senate in 2025.
A combination of spending cuts and tax increases helped reduce the U.S. government debt in the 1940s under the Truman Administration and the 1950s under the Eisenhower Administration. Spending cuts are often key to reducing debts and deficits.
One of the main issues with either cutting spending or increasing taxes is that “the beneficiaries of tax-payer fueled spending often balk at proposed cuts.” Issues Americans care about, from cancer research to solutions for homelessness, are funded by federal dollars.
According to the Manhattan Institute’s Brian Riedl, “voters typically prioritize deficit reduction in theory yet oppose nearly all tax increases and spending cuts that would significantly accomplish that objective.” This often means politicians, whose tenures in office depend on the votes of their constituents, avoid taking actions that may be necessary for spending but will likely anger voters. This often means politicians, whose tenures in office depend on the votes of their constituents, avoid taking actions that may be necessary for spending but will likely anger voters.
The CBO predicted in 2024 that the deficit and the public debt will increase. The calculations show that the deficit will reach 8.5% of the GDP, and the public debt will rise to 166% of the GDP by 2054. These projections are down from the 2023 report due to the Fiscal Responsibility Act of 2023 and the Further Continuing Appropriations and Other Extensions Act.
Another question is exactly how to reduce the deficit and when to start efforts to reduce spending. Reducing deficits through spending cuts as soon as possible would “require older workers and retirees to sacrifice more but would benefit younger workers and future generations.” Waiting to make such changes in spending “would require smaller sacrifices from older people but greater ones from younger workers and future generations.”
Decreasing deficits is a long-term goal and thus requires long-term thinking. Although cuts in spending or increases in revenue would “dampen overall demand for goods and services, thus decreasing output and employment,” such a dampening is only expected to be temporary. Prices and interest rates would respond in accordance with supply and demand, and the Federal Reserve would also take monetary policy actions. The Manhattan Institute’s Brian Riedl suggests long-term adjustments such as setting a specific target so lawmakers share a goal to work towards in negotiations and creating “laws that impose gradual reforms down the road” for future savings.
See The Policy Circle’s Economic Growth Brief for more on these economic effects.
Economic experts and policymakers have different approaches to excessive debt, but it is an important issue for citizens, especially regarding elections. It is clear to voters and fiscal analysts that continually spending more than is coming in is not fiscally responsible. The nation’s debt needs to be brought down to a sustainable level. Understanding the primary drivers of our debt is half the battle, but it amounts to little without actually taking steps to enact reforms that foster a fiscally solvent agenda.
Measure: Find out what the Congressional Budget Office, your federal representatives, and your state/district are doing about budget concerns.
Identify: Who are the influencers in your state, county, or community? Learn about their priorities and consider how to contact them, including elected officials, attorneys general, law enforcement, boards of education, city councils, journalists, media outlets, community organizations, and local businesses.
Reach Out: You are a catalyst. Finding a common cause is a great opportunity to develop relationships with people outside of your immediate network. All it takes is a small team of two or three people to set a path for real improvement. The Policy Circle is your platform to convene with experts you want to hear from.
Plan: Set some milestones based on your state’s legislative calendar.
Execute: Give it your best shot. You can:


The Policy Circle is a nonpartisan, national 501(c)(3) that informs, equips, and connects women to be more impactful citizens.