
Water and Power
When we turn on the tap or buy bottled water, we don’t normally consider where it comes from. Water affects almost every aspect of our lives, from sta…
Read
POLICY CIRCLE BRIEF
Every five years, the American Society of Civil Engineers rates the nation’s infrastructure. In 2021, the U.S. received a grade of C-minus, up from a D-plus in 2017. Of the 17 infrastructure categories evaluated, 11 received a D grade. The ratings were released in March, just one month after “power and water failures due to brutal winter storms and extreme cold [showed] many infrastructure systems are increasingly susceptible to catastrophic failure.”
The power failures refer to the blast of Arctic air in Texas that “left more than 4 million people in the dark and the cold, and even more without clean water” as both natural gas plants and wind turbines were frozen. In the early 2000s, Texas deregulated power generation and required roughly 60% of consumers to buy electricity from private power companies (investor-owned utilities or retail electricity providers), as opposed to municipally-owned utilities or electricity co-ops. The idea was to “create an efficient, go-it-alone electricity market built on gas, coal, nuclear, and wind” to foster competition, lower prices, and prevent monopoly utilities.
The market design “rewarded companies that could sell electricity inexpensively and still recover their capital costs. But it provided little incentive for companies to spend cash on infrastructure that could protect power plants during sporadic severe cold snaps.” In February 2021, freezing temperatures and outages caused power plant equipment to shut down while demand kicked up as furnaces and heaters kicked on. Grid engineers ordered utilities to implement blackouts “in a desperate bid to get energy consumption back in balance with available supply.”
That week, electricity wholesale power prices reached about $9,000/megawatt hour. They usually average between $25-$50/megawatt hour. The cost of electricity during that single week was more than $46 billion, more than five times what Texas spent on electricity in all of 2020. The system itself is being called into question, especially since analyses have found customers of Texas’s deregulated electricity market pay more for electricity than state residents served by municipally-owned utilities or electricity co-ops. Meanwhile, Texas’s Midwest power network, was able to recover quickly from rolling blackouts; unlike the rest of the state, this power network is managed by grid operators linked to the rest of the country.
Are more connections the answer? While Texas deregulated, California started producing huge amounts of wind and solar energy. It increased the amount of solar capacity in its grid to more than one-third of the nation’s total solar output and helped build an 11-state power market “that enables it to export excess solar power during the day and draw in electricity from other sources after sunset.” However, like Texas, extreme weather crashed the power grid and “left people stranded in the dark” after California resorted to cutting off utilities during windstorms to reduce the chance of starting a fire. The problem of blackouts occurred when there was a demand surge, the output from renewable energy dropped when the sun went down, and California could only import a limited amount of power from other states.
For more about how Texas’s system works, listen to this WSJ Podcast (4:40-11:10).
To meet the demands of a growing society always in motion, we need energy sources that are:
In the face of more extreme weather events, a crucial question is how to structure competitive power markets for the 21st century to find a balance of these needs.
Taking action to protect the environment came on Americans’ radar in the 1960s; disasters from oils spills to contaminated rivers bursting into flames resulted in heightened public concerns. The Nixon Administration sent a plan to address pollution to Congress, which included consolidating responsibilities under one agency, which would become the Environmental Protection Agency (EPA) in 1970.
With the EPA as an enforcer, the main U.S. laws addressing the environment passed in the early 1970s:
Thompson Earth Systems Institute at the University of Florida explains the history of U.S. environmental laws (3 min):
“Federal environmental regulation arguably represents the most expansive assertion of federal authority. Even where federal environmental programs are cooperative in nature, environmental regulation calls upon the federal government to affect, influence, and regulate a wider range of behavior – economic and otherwise – than any other area of federal concern.” – Jonathan H. Adler, Case Western Reserve University School of Law
A key part of the history of energy and environment is that of creative destruction, an economic term coined by Joseph Schumpeter that refers to the “product and process innovation mechanism by which new production units replace outdated ones.” As described in this MIT Press article,
“Each wave of technological innovation…fundamentally overthrew the old order in a few decades, killing off a lot of old companies, institutions, and infrastructure. Each wave also created vast new domains of opportunity and riches for those whose innovations were ready to ride the swell at just the right time.”
For example, the period from roughly 1830-1900 was marked by steel production, which made railways, high-rise buildings, and larger ships possible. Businesses invested in steel – the Rockefellers, Vanderbilts, and Carnegies – were the most influential. In the years from 1900-1970, the assembly line and electricity for lighting, cooling, and heating made large volumes of consumer goods available at ever-lower prices, notably cars that ran on petroleum. Exxon rose to power, and the families of the steel and rail era were overtaken by those that embraced mass production techniques such as the Fords, Mellons, and Waltons.
From 1945-1990, the adoption of the transistor and semiconductor, pieces at the basis of all electronics, spawned television companies and telecommunications networks, catapulting computer companies like IBM over petroleum companies like Exxon, and introducing global networks of world connectivity. Today, in the digital age, almost half the world is connected to the internet, and companies on top include Apple, Google, Microsoft, Amazon, and Facebook.
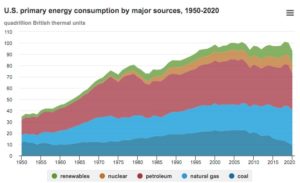
The following chart breaks down U.S. energy consumption from 1950-2020:
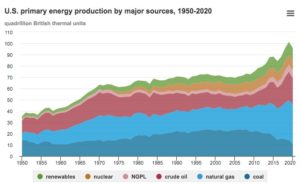
And energy production from 1950-2020:
The U.S. uses and produces energy sources including fossil fuels (petroleum, natural gas, and coal) nuclear energy, and renewable sources. The following chart from the U.S. Energy Information Administration shows U.S. energy consumption:
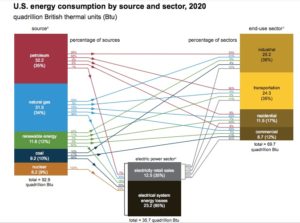
The largest consumer of energy was the electric power sector, which consumed roughly 38% of all energy in 2020 and generated 96% of total U.S. electricity generation. This generated power was sold to the other major energy consuming sectors: transportation (26%), industrial (24%), residential (7%), and commercial (5%).
The following chart shows U.S. energy consumption by source and sector. For example, it shows that 68% of U.S. petroleum went to the transportation sector and 26% went to the industrial sector. With these ratios, petroleum supplied 33% of all energy consumed by the industrial sector and 90% of all energy consumed by the transportation sector.
In 2019, U.S. energy production exceeded consumption for the first time since 1957. Although energy production declined in 2020, it was still greater than consumption.
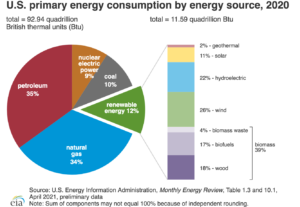
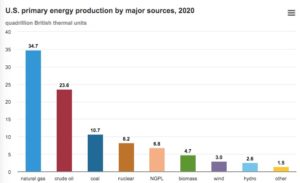
Fossil fuels accounted for 79% of U.S. energy production in 2020 (36% natural gas, 32% petroleum, 11% coal), renewable energy accounted for 12%, and nuclear power accounted for 9%. The following chart breaks down 2020 production (measured in units of energy).
In terms of fossil fuels, increased U.S. production has resulted in less dependence on Middle East oil. In fact, the U.S. is now a net exporter of crude oil and refined petroleum products for the first time in 75 years. The complexities of global supply chains prevent America from being completely energy independent, but as Heritage Foundation’s Nicolas Loris explains, “America’s increased supplies and inventories is providing a welcome cushion to withstand the adverse economic impacts of geopolitical events.” See oil production by state here, from Visual Capitalist.
In 2020, renewable energy sources (wind, hydroelectric, solar, biomass, geothermal) generated a record 834 billion kilowatt hours of electricity, accounting for 21% of electricity generated in the U.S. and surpassing energy produced from coal and nuclear for the first time. Only natural gas produced more. At a utility scale, solar increased 26%, while small-scale solar (grid-connected rooftop solar panels) increased 19% from 2019.
Kite & Key Media breaks down where each state gets its power from (2 min):
For a global perspective of what powers the world, see this map.
Below are the top ten countries, in order, with the most natural resources.
With energy production and consumption inevitably comes emissions. The Union of Concerned Scientists breaks down each country’s share of CO2 emissions with data from the International Energy Agency.
China takes the lead, accounting for 28% of global emissions annually, followed by the United States with 15% of global emissions. India is third (7%) and Russia fourth (5%). When measured in terms of per capita emissions, Saudi Arabia has the highest emissions (averaging 18.48 metric tons per person). The U.S. ranks fourth with 16.56 metric tons per person, and Canada fifth with 15.32 metric tons per person. By this measure, China ranks thirteenth with 7 metric tons per person.
Calculate your own carbon footprint with this calculator from the EPA. See estimated regional emissions of methane from different sources in the U.S. here.
Politics has long influenced how we view energy and the environment. According to Article I, section 8 of the U.S. Constitution, “The most important source of federal power to regulate in the environmental field is found in the commerce clause. The clause, especially as it pertains to congressional authority to regulate activities affecting commerce, has been so expansively applied by the federal courts as to justify federal control of virtually any problem of environmental pollution.”
Additionally, “the property clause of Article IV, section 3 gives Congress the power to ‘make all needful Rules and Regulations respecting’ the property of the United States,” which implies that Congress may “regulate the use of its own lands, and perhaps adjacent lands as well, to protect environmental conditions and promote ecological balance on government property.”
Congress has the ability to direct, by changing language in current laws, how much influence the federal government can exert. The following congressional committees play an important role in the federal environmental sector:
Congress passes laws, such as the Clean Air, Clean Water, and Endangered Species acts. Enforcement and management is usually handled by federal agencies.
The Environmental Protection Agency (EPA) is responsible for ensuring federal laws protecting human health and the environment are administered and enforced as Congress intended. It issues regulations for Congress’s environmental laws, such as setting national standards that states and tribes must enforce. The EPA’s budget of approximately $4 billion is used for research and grants to state environmental programs, nonprofits, and educational institutions to conduct scientific studies. See regional grant information, and find the EPA in your state.
The Department of Energy addresses the energy, environmental, and nuclear challenges facing the U.S., primarily by funding research and innovation. Two major programs include the Loan Programs Office for large-scale energy infrastructure projects (with a projected budget of $40 billion), and the Advanced Research Projects Agency-Energy (ARPA-E) which funds “high-potential, high-impact energy technologies that are too early for private-sector investment.” As of May 2021, ARPA-E has provided $2.8 billion in research and development funding since 2009, leading to over 750 patents issued by the U.S. Patent and Trademark Office.
The Department of the Interior “protects and manages the Nation’s natural resources and cultural heritage,” and “plays a central role in how the United States stewards its public lands, increases environmental protection, pursues environmental justice, and honors our nation-to-nation relationships with Tribes.” Bureaus under the Department of the Interior include the Bureau of Land Management, Bureau of Ocean Energy Management, U.S. Fish and Wildlife Service, and National Park Service.
The federal government controls 28% of America’s land area, equivalent to 640 million acres. More than 95% of federal lands are administered by five government agencies: the Bureau of Land Management, the US Fish and Wildlife Service, the Forest Service, the National Park Service, and the Department of Defense. In many areas of the western United States, major industries and economic activities like cattle grazing, logging, and oil drilling occur on federally-owned lands. There is considerable debate in this part of the United States on how to balance priorities like conservation, recreational activities, and economic development, and to what degree state and local level interests should influence the administration of federal lands.
The Federal Energy Regulatory Commission (FERC) is an independent agency that regulates the interstate transmission of natural gas, oil, and electricity, as well as natural gas and hydropower projects, with the overall goal of assisting consumers “in obtaining economically efficient, safe, reliable, and secure energy services at a reasonable cost”. FERC’s specific roles include regulating wholesale sales of electricity in interstate commerce; determining whether certain mergers in the energy sector are in the public interest; and regulating pipeline construction and natural gas transportation. FERC has not gone without criticism, with many claiming regulations have resulted in major delays in clean energy construction projects or have made it difficult for new entrants to enter the energy sector.
To learn more about the role of FERC, watch The Policy Circle’s Summit video capsule interview with Commissioner Allison Clements (17 min):
Beyond those that are directly involved with energy and environmental policies, many other agencies and departments interact in this sector. For example, the State Department’s Bureau of Energy Resources leads efforts to develop and promote international energy policies, such as securing U.S. energy security and independence. The Department of Agriculture’s Rural Development offers grants and funding that provide renewable energy development assistance.
Federal statutes impact what states can and cannot do when implementing environmental policy. The Clean Water Act, Clean Air Act, and Endangered Species Act are a few of the federal statutes that determine local activity. At the same time, states also have a significant impact on the federal level. California’s early air quality regulations contributed to the adoption of the national Clean Air Act. States have passed legislation regulating emissions and have entered regional contracts to try and spur national action.
The Environmental Council of the States is a “national nonprofit, nonpartisan association of state and territorial environmental agency leaders…with the purpose to improve the capability of state environmental agencies and their leaders to protect and improve human health and the environment of the United States of America.” The group believes that “state government agencies are the keys to delivering environmental protection afforded by both federal and state law.”
Additionally, National Association of Regulatory Utility Commissioners (NARUC) is a nonprofit organization “dedicated to representing the state public service commissions who regulate the utilities that provide essential services such as energy, telecommunications, power, and transportation.” Members are the commissioners from all 50 states plus the District of Columbia, Puerto Rico, and the Virgin Islands. Subcommittees include those on critical infrastructure, electricity, gas, water, energy resources, and the environment, with the obligation to “ensure the establishment and maintenance of utility services as may be required by law and to ensure that such services are provided at rates and conditions that are fair, reasonable, and nondiscriminatory for all consumers.” Find your state’s regulatory commission.
Executives of many companies from the oil industry to car manufacturers say climate concerns from employees, shareholders, and customers are pushing them to respond. For example, General Motors pledged to be carbon neutral by 2040, with a $27 billion commitment to electrification. The Climate Pledge, co-founded by Jeff Bezos, is an agreement for carbon neutrality and includes companies such as IBM, Microsoft, Unilever, Coca-Cola, Uber, and Best Buy.
These endeavors are not always easy; for example, the global food industry “faces increasing pressure from consumers, investors and the government to tackle greenhouse gas emissions, food waste, plastic packaging, and water preservation,” but the convenience of single-use plastic packaging has long been part of supply chains, and it is difficult to find recycled material that is food-grade quality level.
Pressure on businesses has been growing; regulators and investors are pressuring businesses to disclose emissions data related to their products and services, but how to calculate all emissions is difficult. Investors and regulators are also looking at how businesses account for climate change and potential risks in their business models.
However, the private sector’s inherent ability to innovate allows companies to respond to the demands of consumers. Partnerships among businesses, corporations, and philanthropic organizations can demonstrate sustainability as a value by collaborating on initiatives. Sustainable Partners, Inc.,fosters such partnerships for education and action around sustainability.
BlackRock, the world’s largest asset manager that held $10 trillion in assets at the end of 2021, updated its global principles and guidelines to focus on climate change and sustainability in December 2020. In 2020, BlackRock held a large stake in over 90% of S&P500 companies, meaning BlackRock has widespread influence; its “willingness to support more shareholder resolutions on socially responsible issues…will set the tone for smaller investors[.]”
Companies in the U.S. may have to disclose information about how they are dealing with climate change soon in any case, as the U.S. Securities and Exchange Commission formally proposed “new rules that would for the first time require businesses to report their greenhouse gas emissions, along with details of how climate change is affecting their business.” The proposal will have a public comment and would be expected to be put into effect in 2024 at the earliest.
Tracking emissions is notoriously difficult; for example, businesses have difficulty capturing and reporting all of their emissions based on three tiers of classification:
Scope 3 emissions in particular are opposed by companies and trade groups including the U.S. Chamber of Commerce, who argue estimating emissions across the company’s operations and including those from outside the company (suppliers and customers) would be burdensome and likely results in incorrect counts.
Funding is also a necessity, and with government debt as high as it is, it may increasingly be up to the private sector to make critical investments in new energy infrastructure. Tech companies have raced to be at the forefront of renewable energy investments. Amazon, Alphabet’s Google, Facebook, and Microsoft are responsible for 30% of all corporate agreements of publicly-disclosed renewable energy purchases. Most of these projects require heavy upfront investment that banks are not willing to finance. Developers in some countries are even saying “tech companies’ willingness to spend upfront…has helped make corporations more important than government subsidies as the main drivers of renewable investment.”
Money managers and individual traders are also continuing to invest, even as renewable energy indexes have posted double-digit declines for 2021. During the first half of 2021, investment in green energy exchange-traded funds amounted to $6.2 billion, on course to pass 2020’s record of $7.2 billion. Experts hypothesize that investors are predicting long-term changes to the energy sector and economy, and that technology will eventually bring the cost of renewables down enough to earn big profits.
The UN Intergovernmental Panel on Climate Change (IPCC) set a goal of global net zero greenhouse gas emissions by 2050 to limit global temperatures from rising more than 1.5 degrees Celsius above pre-industrial temperatures. This limit was set as part of the Paris Climate Agreement, an international treaty that, while legally binding, lacks enforcement mechanisms. A July 2021 report from the IPCC indicates temperatures will reach 1.5C above these levels by 2040. One U.N. Environment Programme report predicts that if every country met its obligations to the Paris Agreement, it would keep warming below 3 degrees C at best. The challenges of a changing climate, including “[i]ncreasingly erratic weather patterns, rising sea levels, failed harvests… will directly affect the health and prosperity of the United States and the world.”
Oil and gas consumption accounts for roughly half of human-generated emissions driving climate change, and industrial uses account for about 20% of emissions. Extracting these resources from the earth also presents a dilemma; in 1912, the average energy return on energy invested (EROI) in the U.S. was 1:100, meaning that it took roughly one barrel of oil to produce one hundred new barrels. By the 1950s, the ratio was down to 1:50, and today sits at about 1:9. According to MIT, even with new technologies and innovations such as fracking, and more rigs to increase supply, “more energy is used on average for each unit of energy returned as time passes.” Additionally, accidents such as oil spills can cause major environmental and economic damage; according to the National Oceanic and Atmospheric Association (NOAA), there have been at least 44 incidents that spilled roughly half a million or more gallons of oil into U.S. waters since 1969.
For these reasons, many environmental groups argue to phase out fossil fuels completely. On the other hand, oil and gas companies are responding to social and political realities. Over 86% of Fortune 500 companies publish sustainability or corporate responsibility reports. Most major companies have followed suit with annual sustainability reports, although the quality and breadth of data varies across companies, and there are few audits of the information. The International Petroleum Industry Environmental Conservation Association provides guidance for sustainability reporting.
The Environmental Leadership Program helps companies remain in good standing with sustainable development initiatives. The U.N. sustainable development goals include the areas of affordable energy access; decent work and economic growth; and industry, innovation, and infrastructure, all of which fit with the industry’s business model and its inherent ability to innovate. Royal Dutch Shell, for example, is looking at combinations of solar, battery storage, and natural gas to power its refineries.
Innovative solutions can continue to serve the environment in a positive way, as seen in the case of abandoned oil rigs. Worldwide, there are more than 12,000 offshore oil and gas platforms, but when reservoirs of fossil fuels are drained, they become defunct. Removing them is expensive and labor intensive, but allowing them to rust damages marine ecosystems. However, the subsurface rig provides the ideal skeleton for coral reefs, which led to the discovery that offshore rigs can be “the most bountiful human-made marine habitats in the world.” In fact, when converted to reefs, the abandoned rigs work so well that on the West Coast platforms have helped revive critically endangered species. In 1984, Congress signed the National Fishing Enhancement Act, “which recognized the benefits artificial reefs provided and encouraged states to draw up plans to turn defunct rigs into reefs.” Alabama, Florida, Louisiana, Mississippi, and Texas all have rigs-to-reefs programs through which oil companies seal the well and remove the upper section of the platform to convert it into a reef. These states have converted more than 500 into artificial reefs.
The fact that “derivative products of both oil and natural gas are pervasive and integral to our modern lifestyles” adds to the difficulty of eliminating fossil fuels. “For consumers that truly want to divest from hydrocarbons and drive down demand, there is a much longer list of plastics and products to limit in addition to shifting to lower carbon emitting transit options.” Worldwide production of plastic doubled between 2000 and 2019. Industry analysts forecast plastic production to double again by 2040, predicting it will be the biggest growth market for oil demand over the next decade. As of 2021, more than 8.3 billion metric tons of plastic material have been produced.
The average U.S. citizen generates 100 kg of plastic waste per year, most of which goes straight to a landfill. A 2017 report claimed 90% of plastic waste “is dumped or incinerated because there’s no cheap way to repurpose it.” Less than 10% of plastic is mechanically recycled more than once, and even recycled plastic usually contains virgin resin to make up for the dip in quality.
Plastic waste in oceans collects in large patches at the center of gyres (large, rotating ocean currents). The largest gyre, called the Great Pacific Garbage Patch, is located between Hawaii and California. It covers an area twice the size of Texas and contains roughly 80,000 ton of plastic waste from North America and Asia.
DID YOU KNOW?
If current trends continue, there will be one ton of plastic waste in the Ocean for every 3 tons of fish by 2025, and more plastic than fish in the ocean by weight by 2050. As “more tonnage of plastic waste enters oceans every year and disintegrates,” concerns about microplastics are on the rise.
The U.S. used to send its waste abroad, but countries all over the world began shutting their doors to foreign waste when their own environments began to suffer. This turned recycling business models in the U.S. on their heads. Recycling centers that used to make a profit by processing recycled materials now pay vendors to truck material away, and have to explain why consumers suddenly have to pay for curbside pick-up. Some media outlets were reporting anywhere between 300 and 3000 municipalities had suspended their recycling programs, although the Recycling Partnership and the Solid Waste Association of North America estimate the number is closer to 50-60. But many more have stopped accepting certain materials including glass, paper, and certain plastics.
PBS explains how your recycling is not always being recycled (5 min):
When China and other countries stopped accepting these materials, it put significant pressure “on the developed world to deal with its own garbage.” Many oil and chemical companies that make the petrochemicals used to manufacture plastic are striking deals with startups pursuing advanced recycling. Advanced recycling is “an umbrella term for processes that use heat or chemicals to turn plastic waste into fuel or reclaimed resin to make new plastic.” A Reuters report examined 30 projects by two dozen advanced recycling companies across three continents, and found most endeavors were between small, advanced recycling firms and large oil and chemical companies or consumer brands, including ExxonMobil, Royal Dutch Shell, and Procter & Gamble. All these operations are either on a modest scale or have shut down, and “more than half are years behind schedule on previously announced commercial plans.” Projects by BP, German BASF SE, and U.S. Texaco (now owned by Chevron) all dropped plans for advanced recycling over 20 years ago due to technical and commercial problems.
Advanced recycling companies struggle with the same issues as traditional recyclers: “the expense of collecting, sorting and cleaning plastic trash, and creating end products that can compete on price and quality with fossil fuels or virgin plastic.” The main problem comes with melting different numbered plastics together, as this produces “a complex blend of hydrocarbons that must then be separated and purified for reuse,” which requires a lot of energy and yields products that don’t measure up to the original material in terms of quality.
One option is then to start at the top with manufacturing; a team at the Lawrence Berkeley National Laboratory is working on a new plastic that could be recycled indefinitely. A recent study showed that it could be commercially competitive, although competing with oil and chemical companies may be no small feat. Researchers are also looking into using other biodegradable materials, such as seaweed and kelp, as plastic alternatives.
Internationally, there has been a trend to ban single-use plastics to cut down on litter and reduce waste that ends up in waterways. This is particularly apparent with plastic bag bans, such as in the European Union and at least eight states in the United States.
Resources that will essentially never run out are known as renewable resources. They include biomass energy, hydropower, geothermal energy, wind energy, and solar energy. For the most part they are known for producing clean energy, meaning less pollution and greenhouse gas emissions in comparison to fossil fuels. The WSJ takes a deep dive into the status and outlook for five types of carbon-free energy.
One of the main dilemmas pitting renewables against older fossil fuels is “cheaply storing large amounts of electricity to power grids when the sun isn’t shining and the wind isn’t blowing.” Even amid efforts to shift to renewable sources, global demand for energy continues to leave the world at least partially dependent on fossil fuels, as evidenced by energy price shocks over the summer of 2021. To meet global energy demand, investments in clean energy and renewable sources “would need to grow from around $1.1 trillion in 2021 to $3.4 trillion a year until 2030.”
Batteries do not yet have the capability of storing enough energy to meet global energy demand, and are already expensive. Batteries for smartphones, electric cars, and the power grid are lithium-ion batteries, which cost between $50 and $80 per kilowatt-hour of storage. Although lithium is great for electrification that allows for decarbonization, it requires extensive mining.
Kite & Key Media explores the resource extraction that goes into this clean energy (6 min):
A number of teams are working on this challenge; one startup, Form Energy Inc., is developing a battery from iron, which could cost less than $20 per kilowatt-hour for a full battery system. A research team from Brown University and the University of Maryland developed batteries with conductors made of fibers derived from wood to replace the flammable and toxic chemical materials in current batteries. Like many others, these batteries are still in the testing and development phase, meaning they may not be functional on a larger scale for years to come.
The U.S. and Europe encounter another issue as demand for solar energy increases and they install solar panels “on small rooftops and in sprawling desert arrays: Most of them are produced with energy from carbon-dioxide-belching, coal-burning plants in China.” Chinese factories supply more than 75% of the world’s polysilicon, an essential component in most solar panels. China’s “low-cost, coal-fired electricity” has given the country’s manufacturing sector a competitive advantage while producing twice as much carbon dioxide as manufacturing panels in Europe.
In the transportation sector, which accounted for 25% of global carbon dioxide emissions in 2019, replacing kerosene and diesel with renewables has proven difficult. One idea is to use biofuels, which involves turning household trash into low-emissions fuel via a process known as pyrolysis. Waste produces methane, which comprises 20% of global greenhouse gas emissions, but turning waste into energy prevents this. Biofuels reduce emissions by up to 80%, but it is a struggle to use more than a small fraction in transportation because of supply constraints and high costs.
Biofuels can cost up to four times more than conventional jet fuel. Biofuel was used in less than 0.2% of flights from 2016 to 2020. United Airlines, for example, has used 4 million gallons of biofuels since it started using them regularly in 2016, compared with 4 billion gallons of conventional jet fuel. The U.S. Energy Department reports there are 340 million tons of biomass available for biofuel in the U.S., and planes alone would require several hundred million tons.
The discussion of renewable energy sources must include the electric grid. The Wall Street Journal refers to the “electrification of everything” as the concept that more energy will come from electricity, instead of gas or oil, as is the case with cellphones and the conversion of cars. One study from Princeton University estimates that electrifying nearly all transport and buildings could lift electricity’s share of energy used in the U.S. from about 20% to 50% by 2050.
The U.S. electric grid, at present, connects 9,000 electricity producers to millions of consumers through six million miles of transmission lines managed by more than 3,000 different private and public organizations. Experts call for investments and necessary upgrades for a more modern and reliable grid; some parts of the grid were built in the 1950s and 1960s. The grid must be able to serve consumers and the economy with a mix of energy sources, from renewables gaining ground to fossil fuels because batteries do not have the necessary storage capabilities yet. The $1 trillion bipartisan infrastructure bill passed over the summer of 2021 included $65 billion to improve “the reliability and resiliency of the nation’s power grid.”
The Texas Public Policy Foundation explains the electric grid (2 min):
One idea is to make the grid a more connected system. Replacing “coal and natural gas power plants with large wind and solar farms hundreds of miles from cities” would require lots of new power lines to further tie together a national system, rather than just a regional one, to use the sun in California and the wind in Wyoming to send power across the country. The argument is that more grid connections will increase energy security, because areas that are unaffected can supply power to disrupted markets.
On the other hand, more connections can increase the risk of cyberattacks “by providing more gateways and larger linked attack surfaces for hackers to enter undetected into a vital system to interrupt U.S. economic activity or safety.” There is some evidence that renewables may have an upper hand here, as a cyberattack that damages a large power plant could take months to repair due to its structure, but a solar mini-grid may only be down for a few days.
Those in favor of a more decentralized system argue solar panels, batteries, and other local energy sources would be more resilient and could be built more quickly. In fact, when millions of California homes went dark during a heat wave, the batteries and rooftop solar panels installed in homes, businesses, and municipal buildings added 4% to the state’s energy. This does not sound like a lot, but electricity has flowed from power plants to people almost exclusively for over a century. Through small-scale investments, homeowners, businesses, and others that have traditionally been consumers can become energy producers, reflecting the desire for more control over their own electricity. The most common are rooftop solar installations, or whole-house generators (often powered by propane or natural gas).
Another major issue the U.S. faces is that utilities are rewarded for promoting higher electricity use, not energy conservation or efficiency. Some argue that new fee structures would “give utilities an incentive to adopt more resilient, innovative technologies”. Additionally, cities across the country have enacted ordinances to encourage all-electric construction, which puts pressure on the real estate and construction industries to adhere to new standards that have been quickly rolled out, and may raise building costs.
Global debates about how to mitigate climate change tend to be “reduced to renewable energy vs. fossil fuels, electric cars vs. gasoline cars, or energy efficiency vs. energy waste.” These are key components of addressing environmental challenges, as discussed above, but another often overlooked strategy is looking to nature. More than 25% of global emissions come from forestry, agriculture, and land-use changes, so working in the area of conservation, restoration, and land management can offer distinct environmental advantages. Proponents point to the enormous investments, construction, and modernization that clean energy solutions require, citing natural climate solutions as “the most cost-effective means for rapidly reducing net greenhouse gas emissions.”
Areas of the planet that absorb more carbon from the atmosphere than they give off are known as carbon sinks. Since the 1960s, carbon sinks have taken in about 25% of carbon emissions from fossil fuels; in fact, heavily forested nations including Bhutan, Panama, and Suriname are carbon negative.
A report from the Proceedings of the Natural Academy of the Sciences found nature-based solutions can account for 37% of all emissions reductions required by 2030 by the Intergovernmental Panel on Climate Change.
DID YOU KNOW?
However, deforestation is hampering this. One study focusing on one of the world’s largest carbon sinks, the Amazon, found the rainforest released 20% more CO2 into the atmosphere than it took in from 2010 to 2019. In particular, the eastern amazon (30% deforested) emitted 10 times more carbon than the west (11% deforested). As a result of deforestation, there are fewer trees to produce rain, meaning more droughts, tree deaths, and fires are likely.
In 2018, global tree cover removed over 37 metric tons of CO2 from the atmosphere, about 30% of combined emissions, but deforestation accounts for 8-10% of increases in CO2 emissions globally. To hit net zero emissions targets by 2050, one estimate suggests two billion metric tons of CO2 will need to be removed, and strategic tree restoration alone could meet 20% of that target.
One aspect that is particularly popular is that reforestation can “leverage private-sector investment, engage rural communities, and conserve some of America’s most beautiful landscapes and ecosystems.” In the U.S., forestland removes about 15% of U.S. emissions annually. Legislation that provides for incentive-based restoration policies, tax deductions, and competitive grant programs can also be beneficial. Private sector involvement is essential as well; in Michigan, a carbon off-set program between Michigan’s Department of Natural Resources and the state’s largest energy company represents the first pact between a private company and state land. DTE Energy will pay the state to leave more trees standing. The fact that over half of forestland in the U.S. is privately owned means local communities and private owners have an important role to play. Endeavors can foster community engagement, improve public health, encourage outdoor recreation, beautify urban and rural areas, and even support jobs.
At the COP26 climate summit in October 2021, world leaders from more than 100 countries (including the U.S., China, and Brazil) agreed to a deal that would protect and restore forests from Russia to the Amazon to the Congo. The agreement is not legally binding and is short of detailed policies for execution. It commits almost $20 billion of public and private funds to the reforestation goal.
Planting on land is not the only popular idea; Running Tide Technologies proposes to farm kelp, and to “bury massive amounts of seaweed at the bottom of the ocean, where it will lock away carbon for thousands of years.” Running Tide is one of a number of startups trying to prove that conservation, sustainable fishing, and carbon sequestrations can be profitable, especially as global shipping and appetite for seafood increases around the world.
In the U.S., food and agriculture supports 22.8 million jobs (15% of total employment) and generates economic output of over $2.1 trillion annually. The agricultural industry has a direct effect on soil health, water conservation, and biodiversity, and accounts for roughly 10% of carbon emissions in the U.S.. However, clean installations have led to declines in greenhouse gas emissions in beef production, dairy production, and soy production. The U.S. Farmers & Ranchers Alliance believes emissions could be further reduced by 147% with appropriate agricultural investments.
Examples include investments in improved tilling practices and planting crop varieties with larger root systems, which could remove up to 500 million tons of CO2 annually, according to the World Resources Institute. These efforts could also boost soil health and crop resilience by reducing erosion and runoff, which would also improve water quality, although more research on practicality and impacts on the food system are necessary. In the livestock industry – mainly for sheep and cattle, whose natural digestive processes are responsible for 4% of all U.S. emissions – more research and development is needed to understand effective feeding practices that do not alter necessary industry production. At present, concentrated animal feeding operations (CAFO) emit excessive amounts of air pollutants. Incentive-based policies, such as tax exemptions, certification programs, and competitive grants, can help farmers and ranchers implement innovative practices.
Countries leading the action against climate change are particularly concerned by regulations “because their efforts to achieve deep emission reductions could put their own pollution-intensive producers at a competitive disadvantage in the global economy.”
One belief is that environmental policies increase compliance costs, which will create ‘pollution havens,’ similar to tax havens. The idea is that regulatory costs can be passed down through price increases. This could cause companies in countries with costly regulations to lose market share. It could also affect long-term decisions on locations of new factories or foreign direct investments. A literature review from the University of Chicago found the pollution haven effect is supported but very small, and tends to be overwhelmed by other determinants of trade.
A second idea is that environmental policies will foster innovation in new technologies, which could boost competitiveness and create international leadership in clean technologies. The University of Chicago literature review found stricter regulations lead to higher research and development expenditures and more environment-related patents, but the innovations were not always large enough to outweigh the costs of regulations for regulated entities. Many experts add regulation-induced innovation results in knowledge spillovers for an overall net social benefit.
Almost exclusively in pollution- and energy-intensive sectors, ambitious environmental policies “can lead to small, statistically significant adverse effects on trade, employment, plant location, and productivity in the short run,” but the overall “scale of these impacts is small compared with other determinants of trade and investment location choices.” For the sub-sectors impacted, assessing and evaluating policy options will be necessary to prevent negative economic impacts without negatively impacting incentives to develop cleaner processes.
Whether regulations affect jobs is also heavily debated, and most frequently depends on the specific model and assumptions used for economic predictions. For example, the “American Coalition for Clean Coal Electricity estimated that two EPA rules on power plant emissions would trigger a 1.4 million job loss; meanwhile, using a different model and different assumptions, the Political Economy Research Institute predicted the same two rules would generate a 1.4 million job gain.” The EPA predicted essentially no change. Most often, regulations shift jobs from one sector to another, and policies that support technical job training for growing areas can help address these distributional effects.
For many dealing firsthand with energy, environment, and climate change, regulations are top of mind. Over the summer of 2021, House legislators launched “Hot FERC Summer” to engage the environmental movement with FERC, the independent agency that regulates interstate transmission of natural gas, oil, and electricity, and natural gas and hydropower projects. FERC has been criticized for its “regulatory framework [that] entrenches monopoly incumbents who, under cost-of-service regulation, profit by spending excessive capital and suppressing innovative, lower-cost alternative technologies and new entrants.” R Street’s Devin Hartman argues regulatory reforms that address the lack of competition can spark innovation in the industry and garner more confidence in FERC.
A carbon tax “is a fee imposed on companies that burn carbon-based fuels, including coal, oil, gasoline, and natural gas.” By making it more expensive to use carbon-based fuels, companies have a reason to be more energy-efficient.
The European Union’s Emissions Trading System covers about 40% of the bloc’s greenhouse gas emissions and charges emitters for every metric ton of carbon dioxide they emit. This makes fossil fuel energy more expensive, and has led to energy price spikes for citizens. The EU has also proposed a carbon tax plan that would place levies on imports from high-emitting countries; more specifically, these are known as carbon tariffs, taxes on products imported from countries with laxer environmental regulations or on imported products that require emissions to produce. The European Union plans to implement carbon tariffs by 2026, and there are similar legislative proposals for the US and its allies to adopt common climate policies.
Carbon tariff plans has been condemned by trading partners in the developing world; many of these countries do not have environmental regulations that could hamper their developing economies. Other considerations are for financiers like the U.K. to impose a blanket ban on fossil fuels, so new projects in developing countries would not be allowed to include fossil fuels in order to receive funding. While it may reduce emissions, this could be another burden on economic growth and job creation in developing countries, whose energy use and total emissions are relatively small. Representatives of developing nations point out that industrialized countries have been responsible for most emissions since the industrial revolution began 200 years ago, and argue that they will not be able to rise out of poverty if they are forced to adopt the environmental policies that rich countries adopted and began to promote after they industrialized.
China is set to launch an emissions-trading system that would “put a price on greenhouse gases generated by industry, increasing the costs of products with the intent of permitting efficiency and cutting emissions.” Carbon-pricing mechanisms already exist in 45 countries, but China’s proposal is the largest. Under the plan, known as a cap-and-trade model, emitters “are allocated a certain number of emissions allowances up to a set limit, or cap, and then either trade or buy allowances if they remain below or exceed this.” Each year, the cap is recalculated and reduced, driving greater efficiency. China’s is also unique in that it focuses on emissions intensity rather than absolute emissions; this means total emissions can still increase, as long as companies are reducing the volume of emissions per unit of energy output. Already, China’s policies to curb energy consumption and reduce carbon emissions are causing problems, leading to power outages across many manufacturing hubs in order to hit targets on energy-use limits.
The U.S. does not impose a carbon tax or a cap-and-trade system; both ideas were debated in Congress in the 1990sbut neither passed. Some states, including California and a few in the northeast U.S., do have cap-and-trade systems. The Bertelsmann Foundation breaks down carbon tariffs and political developments (5 min):
The Climate Leadership Council argues for a rethinking of carbon taxes in the form of carbon dividends for Americans. Their plan is to take the proceeds from the carbon tax, which would be imposed both on U.S. companies as well as on imports, and return it to Americans. This dividend could be administered similarly to the Social Security system. The council argues it would send “a powerful signal to businesses and consumers, while generating revenue to reward Americans for decreasing their collective carbon footprint.” The idea could also eliminate the need for regulations, which are often highly divisive, as discussed above. One dilemma with this is that calculating total emissions is notoriously difficult for most companies.
Ted Halstead explains (13 min):
Subsidies are benefits given to individuals, businesses, or institutions (usually by the government). They can be direct, such as cash payments, or indirect, such as government-supported price reductions that allow items to be purchased below market rate.
In the energy sector, subsidies encourage domestic energy production and result in domestic consumers paying lower prices. Energy pricing is influenced by, and influences, “changes in fuel consumption, international energy prices, numbers of people exposed to air pollution, road safety, people’s valuation of environmental risks…”
Most energy subsidies were originally designed to incentivize domestic energy sources, as there was an aggressive push for energy security following the OPEC embargo in 1973. Many U.S. energy production subsidies are embedded in the tax code, so producers can deduct a percentage of their gross revenue, or deduct exploration and development costs. There are also a significant number of incentive programs including research and development grants and contracts, production incentives, and loan guarantees.
Global fossil fuel subsidies were estimated at $4.7 trillion in 2015 (6.3% of world GDP) and $5.2 trillion in 2017 (6.5% of GDP) in 2017. Total U.S. fossil fuel subsidies in 2018 amounted to $592 billion: $198 billion for gasoline, $149 billion for coal, $126 billion for natural gas, and $119 billion for diesel.
Pre-tax subsidies occur when “people and businesses pay less than it costs to supply the energy,” meaning firms receive preferential tax treatment or direct government budget transfers, or they are paid prices that are above supply costs. For example, in the U.S., The Credit for Clean Coal Investment creates “a series of tax credits for energy investments, particularly for coal.” The Department of Energy’s Advanced Fossil Loan Programs Office has provided loans to innovative energy projects since 1005. Between 2010 and 2017, the program provided $2.66 billion to support 794 advanced fossil fuel energy research and development projects.
Post-tax subsidies add to pre-tax subsidies “an amount that reflects the environmental, health and other damage that energy use causes and the benefit from favorable VAT or sales tax treatment”. For example, the total of $592 billion in U.S. fossil fuel subsidies includes external costs borne by society (the social cost of carbon, adverse health effects, etc.), as well as foregone government revenue from inefficient pricing and wear and tear on roadways. The International Monetary Fund estimated that if fuel prices had not been affected by subsidies and were set at efficient levels in 2015, global CO2 emissions would have been 28% lower and tax revenues 3.8% higher as a percent of global GDP.
The following chart breaks down fossil fuel subsidies into pre- and post-tax subsidies. While pre-tax subsidies have fallen slightly over time, the efficiency costs of failing to charge for environmental damages and decreases in revenue have increased. Estimating post-tax subsidies “involves measuring and valuing environmental damages that are often uncertain and very country-specific,” but most experts agree the general idea is that a failure to price accordingly has negative consequences.
Due to these subsidies, underpricing of fossil fuels is “pervasive and substantial,” with coal prices usually less than half what prices would be without subsidies, and road fuels about 20% lower. Coal is the largest source of subsidies (44%), followed by petroleum (41%), natural gas (10%) and electricity (4%). You can compare global energy prices with the International Energy Agency’s mapping tool.
Another concern regarding subsidies is how much producers benefit. A report by the National Academy of Sciences found the “direct financial benefit to fossil fuel producers of inefficient pricing across all four fuels [coal, natural gas, gasoline, and diesel] is estimated at $62 billion per year on average”. For some coal companies, the benefits exceed net income, and for the U.S.’s largest natural gas and oil producers, benefits constitute a median of 18% of net income from domestic operations.
The federal government has long provided incentives to implement renewable energy and energy efficiency measures, and to develop and commercialize renewable energy and energy efficiency technologies, although implementation was limited by the high cost of renewables and little acceptance among commercial markets. After the 2005 Energy Policy Act, renewable energy gained more traction in the U.S. power sector.
Most funding comes from the Renewable Energy Production Tax Credit and Investment Tax Credit. Other sources include the Department of Energy, which operates the greatest number of incentive programs; the Department of Agriculture, which runs several programs focused on biofuels and offers grants and loans to promote energy efficiency for agricultural producers; Housing and Urban Development and Veterans Affairs, which offer energy efficient mortgages; the Small Business Association, which has loan programs to help borrowers upgrade their facilities to be more energy efficient; and Health and Human Services, which offers energy assistance to low-income households. See a full list of programs here, and find federal and state laws and incentives for alternative fuels and efficiency here.
Between 2005 and 2015, the federal government is estimated to have spent $51.2 billion on incentives for solar and wind, 90% of which ($45.8B) came from tax incentives. Another 2% ($1.3 billion) came from credit incentives, which includes grant and loan programs provided by the multiple agencies listed above. Research and development accounted for the final 8% ($4 billion). The following chart breaks down DOE funding for research and development from 1948-2018 (after World War II – note the funding given to nuclear energy and recall the Manhattan Project), from 1978-2018 (when the DOE was created after the 1973 OPEC embargo and calls for energy dependency), and from 2009-2018.
In 2016, the federal government spent $11 billion on renewable energy subsidies and $3 billion on energy efficiency subsidies. Debates about subsidies are likely to continue and gain more attention. Fossil fuels are closely connected to climate change and adverse health effects. Many believe “[m]assive government aid through taxes, incentives and subsidies is needed to bring down the costs” of renewable energy sources so they can compete with fossil fuels. Others argue these energy sources are now competitive enough, and that if there are to be subsidies they should be for new technologies such as energy storage and transmission. A caveat is that decisions about what technologies get more subsidies tend to be driven by politics rather than science, which can lead to a misallocation of resources. One idea is to also phase out subsidies over time, such as by reducing credits as market shares grow to prevent businesses from becoming overly reliant on subsidies.
For a look at pricing of energy sources without subsidies, see this report from Our World in Data.
The world population is growing, nations are urbanizing, and technology is spreading. In essence, global energy demand is increasing. That this is happening at the same time many are warning of adverse consequences on the environment and climate is a significant challenge. A combination of political influence, social values, technological innovation, and efficient use of available resources will define the future of energy policies and their effect on the environment.
Measure: Find out what your state and district are doing about energy and the environment.
Identify: Who are the influencers in your state, county, or community? Learn about their priorities and consider how to contact them, including elected officials, attorneys general, law enforcement, boards of education, city councils, journalists, media outlets, community organizations, and local businesses.
Reach Out: You are a catalyst. Finding a common cause is a great opportunity to develop relationships with people who may be outside of your immediate network. All it takes is a small team of two or three people to set a path for real improvement. The Policy Circle is your platform to convene with experts you want to hear from.
Plan: Set some milestones based on your state’s legislative calendar.
Execute: Give it your best shot. You can:


The Policy Circle is a nonpartisan, national 501(c)(3) that informs, equips, and connects women to be more impactful citizens.