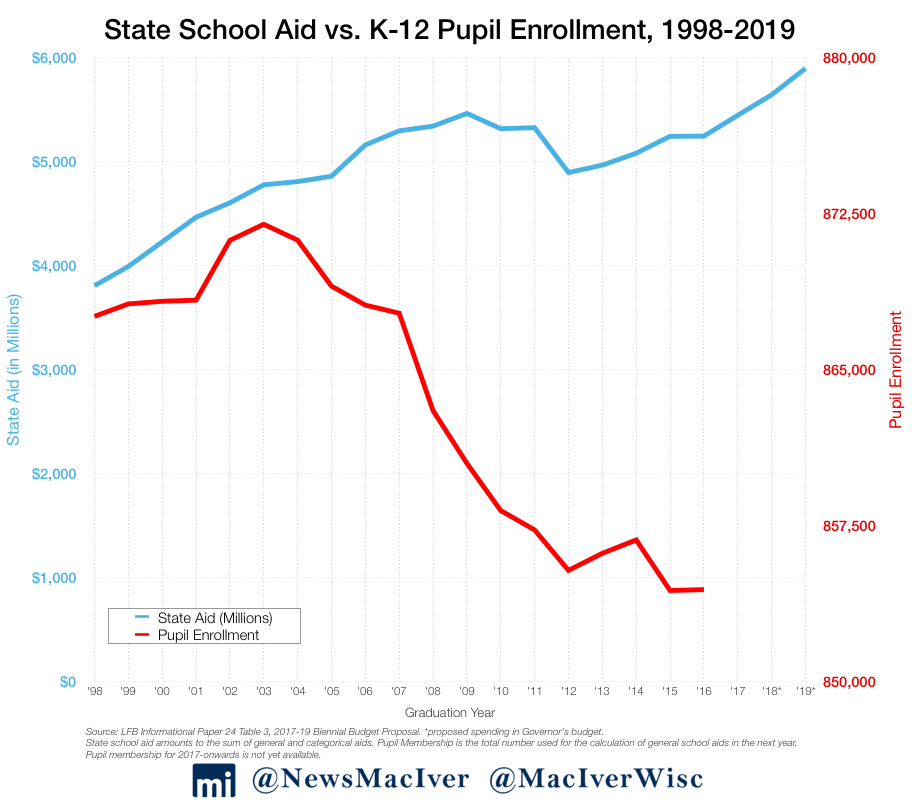
K-12 education is the single biggest line item in every Wisconsin state budget. The current budget, which adds another $636 million to prior funding levels, is no different. While the state has made massive investments in education, student performance has stagnated. At the same time as student enrollment in public schools has fallen, state and local spending has increased.
Introduction
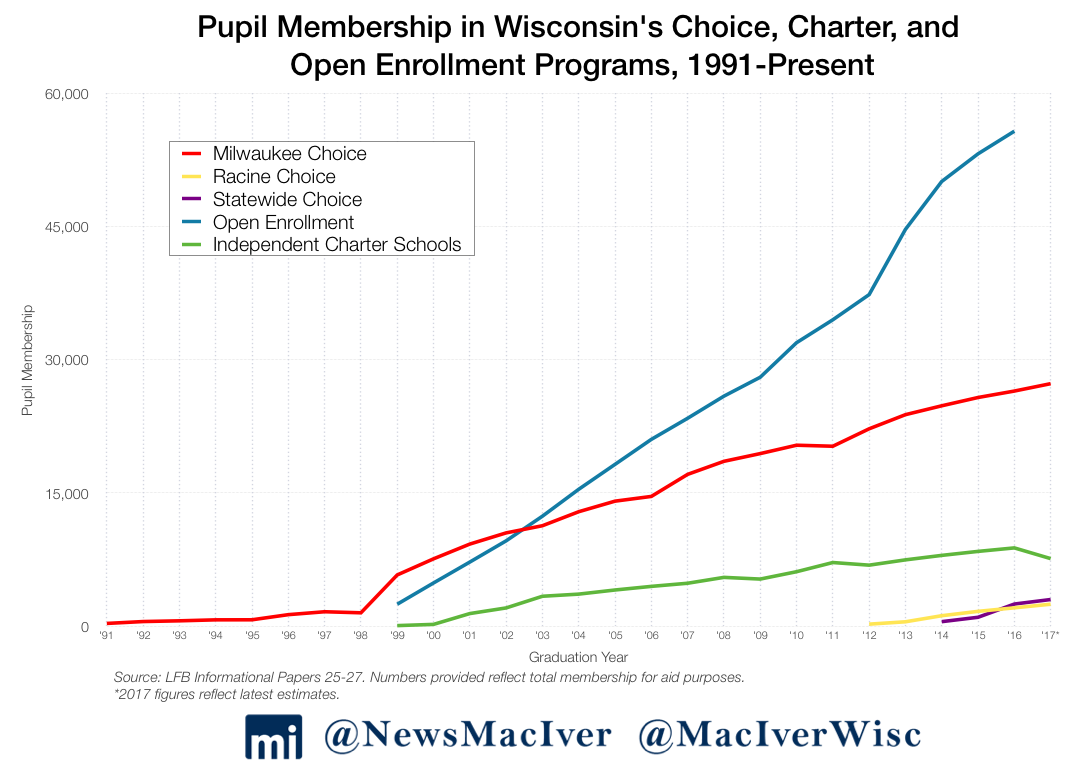
As home of the country’s very first voucher program, Wisconsin has long been at the forefront of school choice access. Tens of thousands of students attend public and private schools outside of their home districts because of programs like Public School Open Enrollment and the state’s various Parental Choice Programs.
Performance and Achievement
The state tracks student performance and achievement through a variety of metrics. Below is a description of the most important indicators we look at, and what the most recent data shows us.
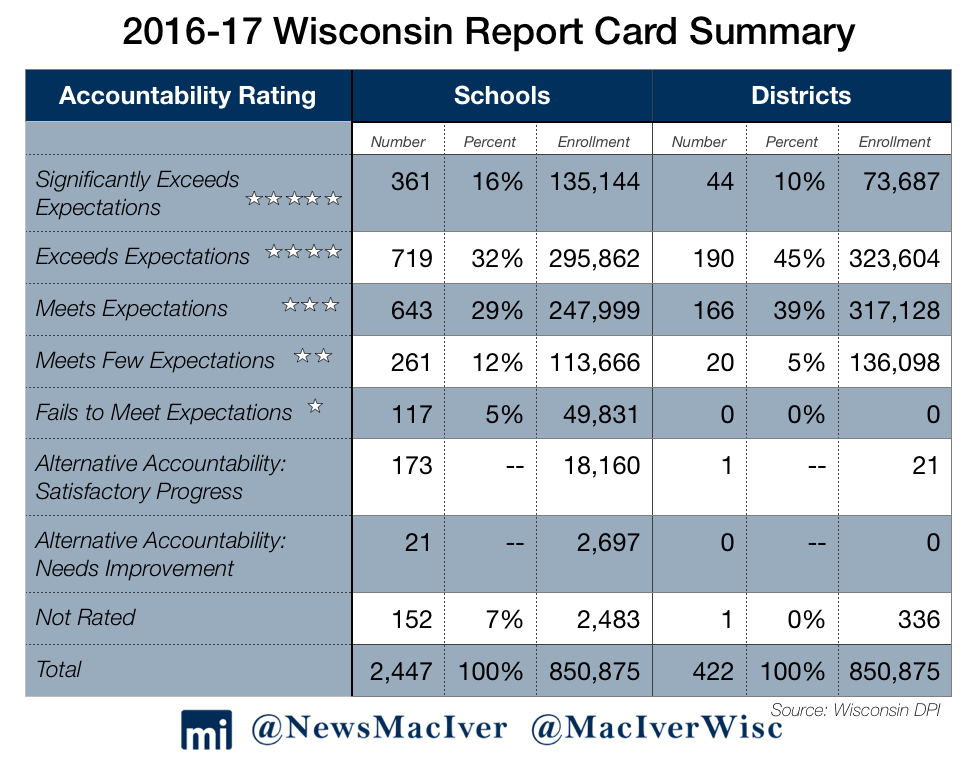
- Report Cards: The Wisconsin Department of Public Instruction releases district and individual school “accountability reports,” also known as report cards, every fall. The reports are based on student proficiency scores on the Forward Exam (detailed below), as well as school and district graduation rates, attendance rates, dropout rates, achievement gaps, and other metrics. The reports rate school districts and individual schools based on a five-star scale from “fails to meet expectations” (one star) to “significantly exceeds expectations” (five stars).
- Forward Exam: The Wisconsin Forward Exam is the standardized test administered by the state every spring to 3rd-8th graders to test proficiency in several subjects. Forward is a relatively new test. The state used the WKCE (Wisconsin Knowledge and Concepts Exam) for many years, before switching to the Badger Exam for one year to align with Common Core standards. Finally, the state settled on the Forward Exam in the 2015-16 school year. The most recent results show that 43% of students are proficient in math, and 44% of students are proficient in English language arts.
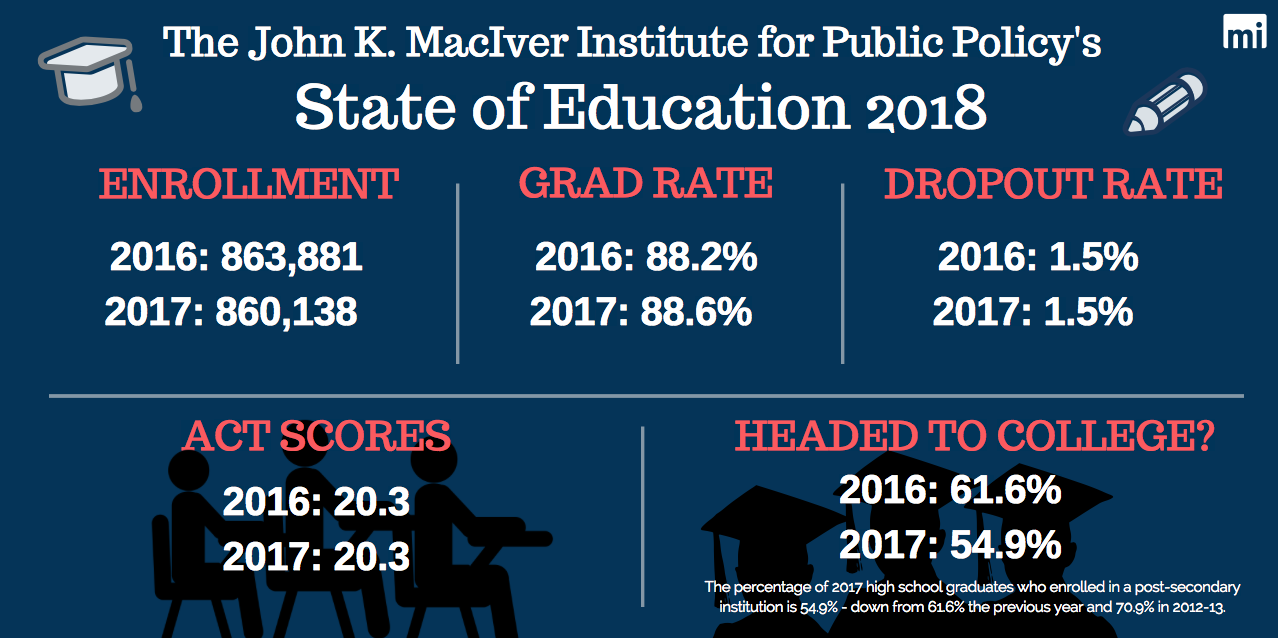
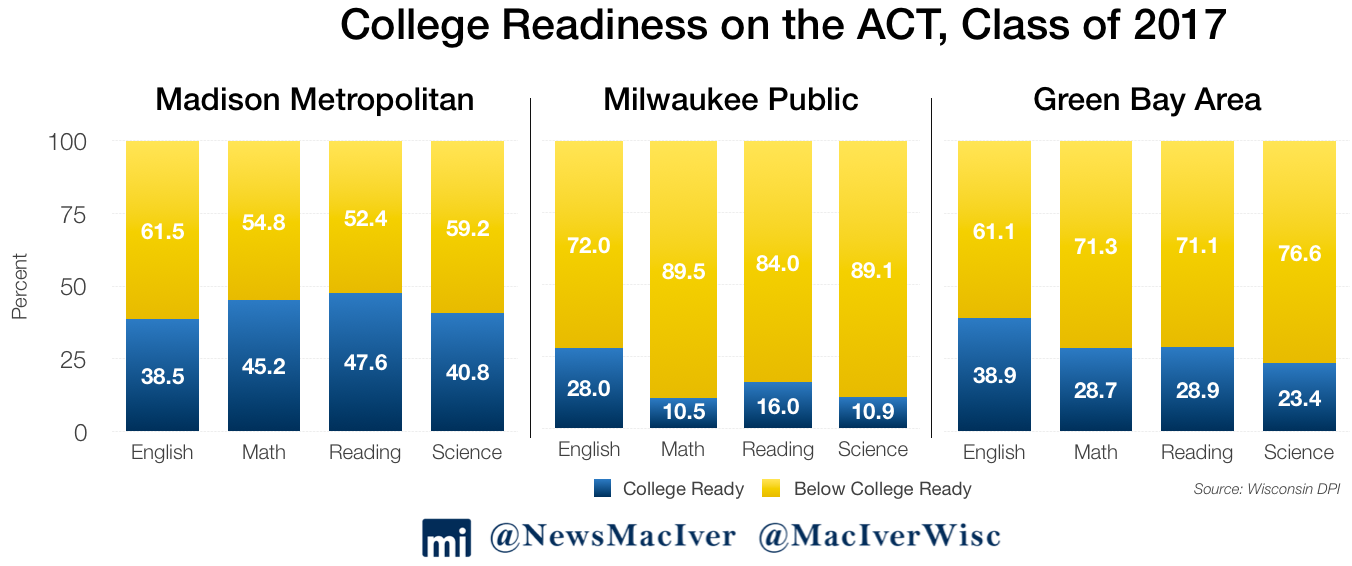
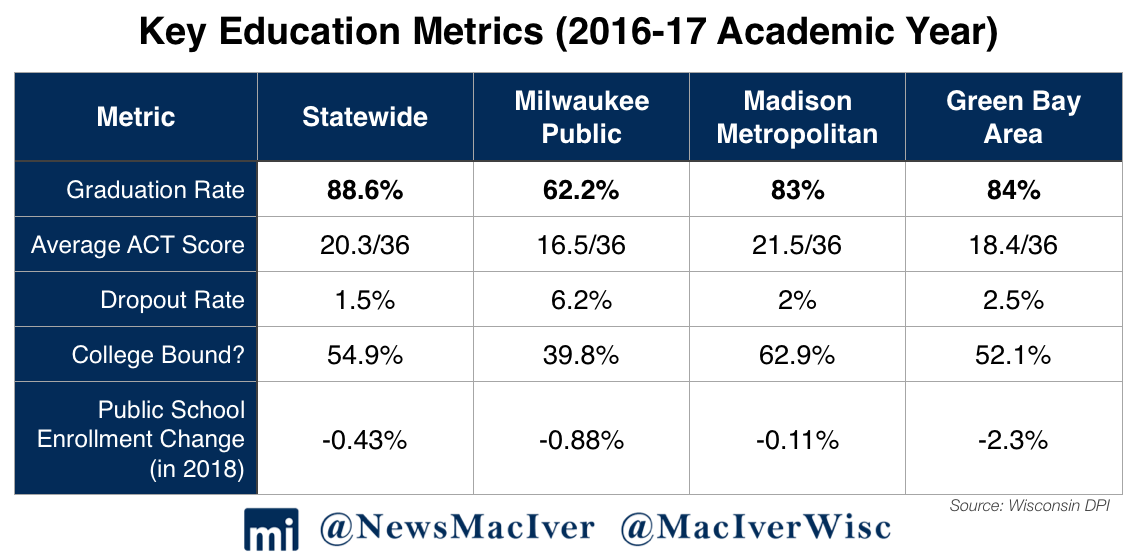
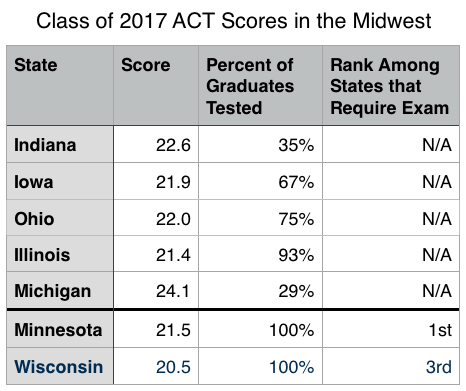
- ACT: The state of Wisconsin now pays for every high school junior to take the ACT exam, which has brought participation way up to 92.1% – among the highest in the country. The average composite ACT score is 20.3 out of 36, also among the highest average score for states where almost all students take the exam. ACT results come out in several batches. The state releases both the average ACT scores for entire high school classes as well as average scores for just one test day. The makers of the ACT itself also release scores every year, which let the public compare results between states.
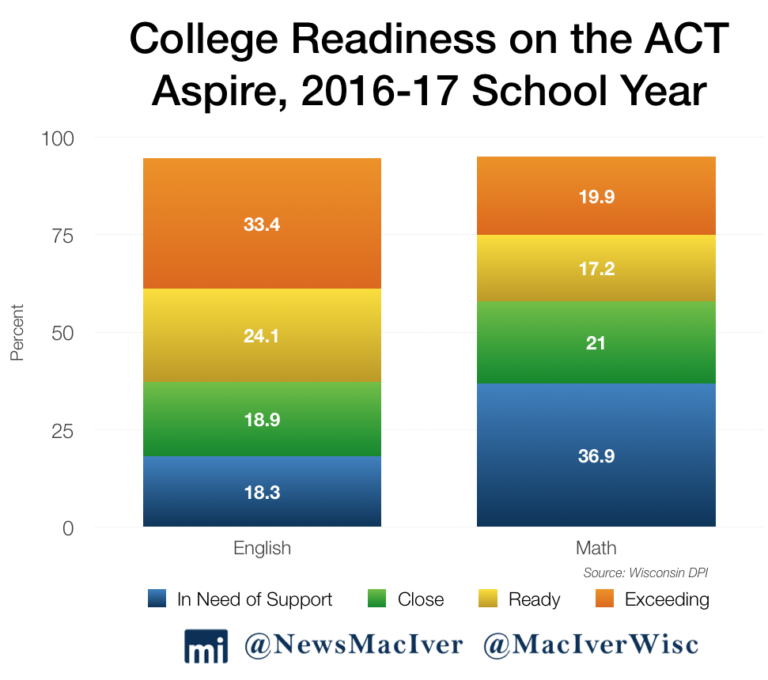
- ACT Aspire: The ACT Aspire is a newer exam taken by high school freshmen and sophomores to get them ready for the “real” ACT that they need to get into college. ACT Aspire results released in March 2018 showed troubling results – fewer students demonstrated proficiency on the ACT Aspire in almost every subject compared to last year. With 57.5% of exam takers “ready or exceeding” in English, students fared the best in that subject area. In math, just 37.1% of students were ready or exceeding.
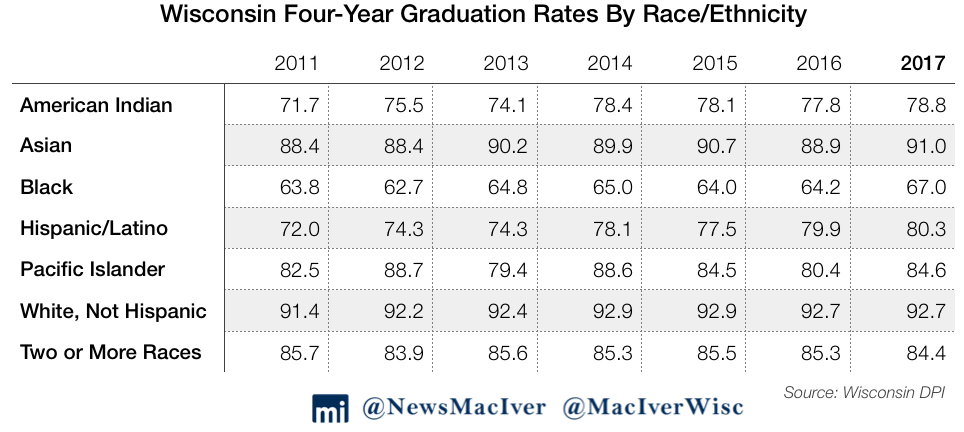
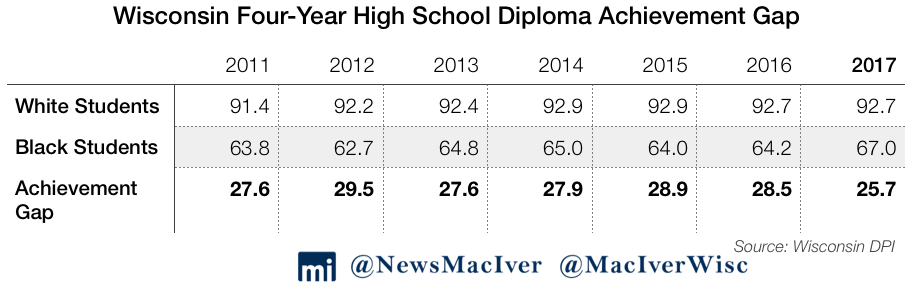
- Graduation Rates: Wisconsin students have one of the highest four-year graduation rates in the country, at 88.6%, but certain districts fall much further behind. MPS, for example, has a 62.2% graduation rate.
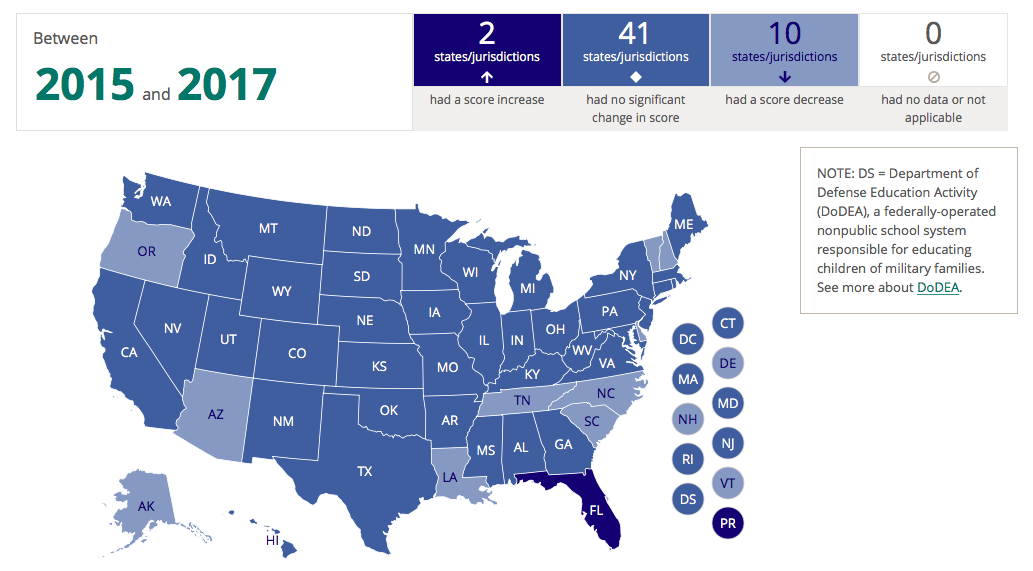
- NAEP: The National Assessment for Educational Progress, also known as the Nation’s Report Card, is a national standardized test that a representative sample of students across the country take every year. State and district level results are released every other year, and the NAEP test results from 2017 were released in April 2018. Overall, Wisconsin generally performed better than the national average but our scores have stagnated. MPS, however, performed worse than the large-city public school district average in both reading and math for both 4th and 8th graders.
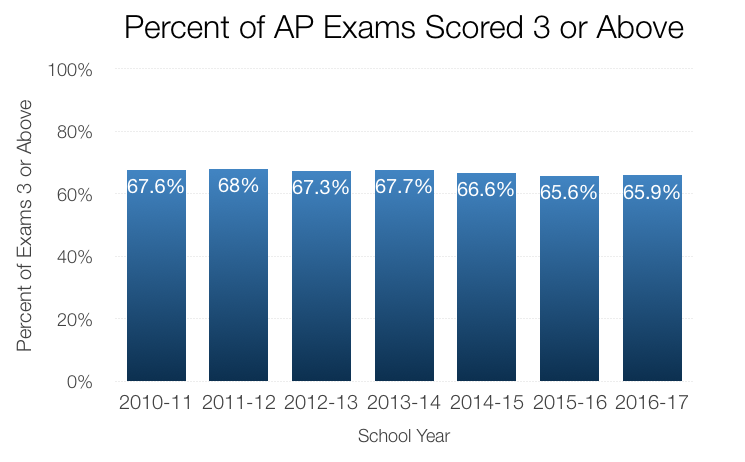
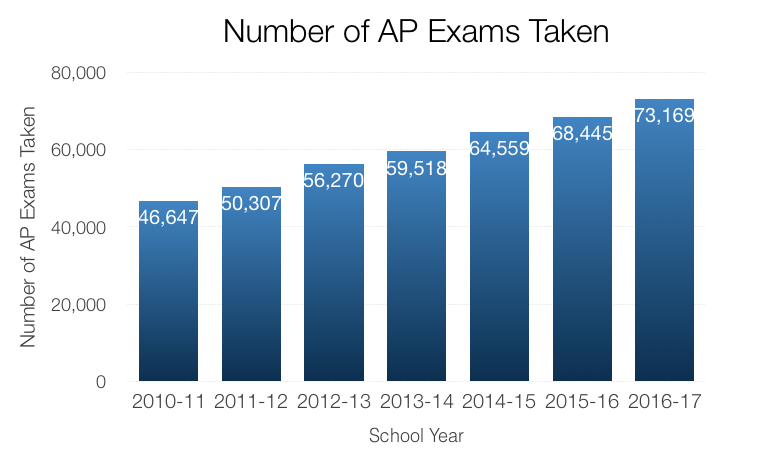
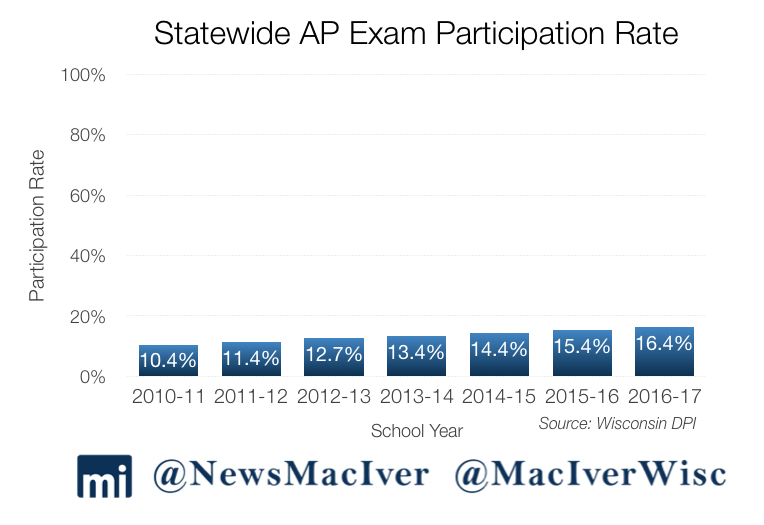
- Many, many others: enrollment, dropout rates, AP Exam participation, college attendance, achievement gaps… education is a data-driven field, and there is no shortage of data points to examine. Before the group discussion, think about why and how certain data points may be more salient than others.
School Choice
The basic principle behind school choice is that every child, regardless of their zip code, should have access to a great education. Traditional home-based districts, wherein students are automatically assigned to a public school district based on where they live rather than whether that school works for them, are becoming eclipsed by newer, more innovative options.
The Milwaukee Parental Choice Program (MPCP) began in 1989 through a coalition of dedicated reformers including Gov. Tommy Thompson, a Republican, and Rep. Polly Williams, a Democrat. About 300 students began attending private schools using vouchers in the 1990-91 school year. The program has slowly expanded and today, more than 28,000 students in Milwaukee participate in the program, attending schools they wouldn’t otherwise be able to afford. Parental choice programs in Milwaukee, Racine, and statewide, as well as the Special Needs Scholarship Program enroll 36,495 students in the current school year.
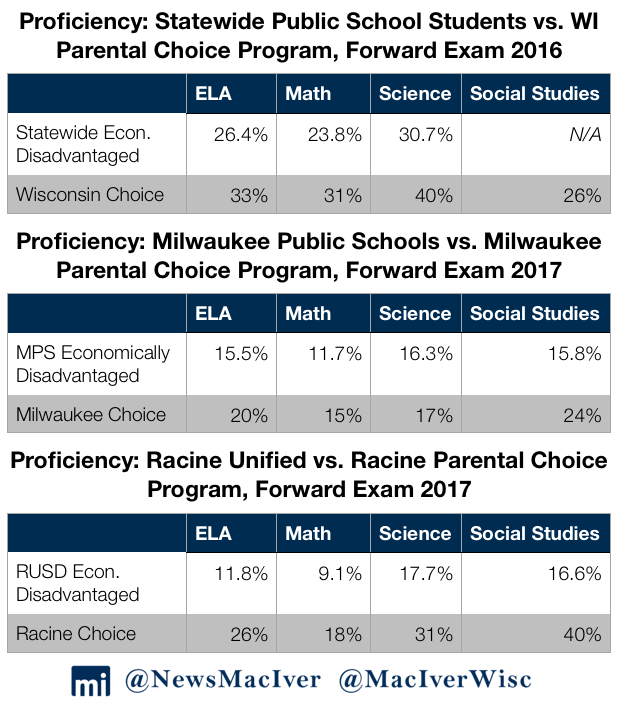
Choice programs receive several thousand dollars less per student than traditional public schools. Despite this fact, students enrolled in choice tend to outperform their public peers, especially when results are controlled for family income.
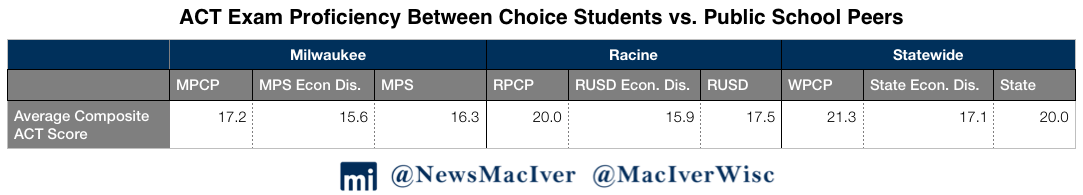
The most recent administration of the Forward Exam saw school choice students outperforming public school peers in every subject on the ACT. Milwaukee parental choice program participants are likelier to go to college and stay in college than their MPS peers. Thinking back to the annual report cards, more than 163,000 students attend schools considered failing or meeting few expectations. Many students apply for the parental choice programs hoping to flee failing traditional schools.
These programs are often a source of tension for public schools, which see less funding when students leave for other schools. However, public school districts do not take on costs of educating children who do not attend their schools. Should they be considered to be “losing” money if they are serving fewer students?
Before the group discussion, think about how states should fund public education at a fundamental level. What does the word “public” mean? Every young person in the state is a member of the public. Should funding formulas and traditional district-run schools and institutions be given priority over individual student needs? Rather than thinking about education in traditional terms – public vs. private – think about what the dollars we spend on education should go towards.
Recent years have seen the expansion of choice access and programs, from the creation of new programs statewide and in Racine (2013), to the Special Needs Scholarship Program (2015), to the raising of income limits (2017). In the 2018-19 school year, participation in the statewide choice program is limited to 3% of each public school district’s enrollment. This cap will increase by 1% every year until it reaches 10%, after which it will no longer exist.
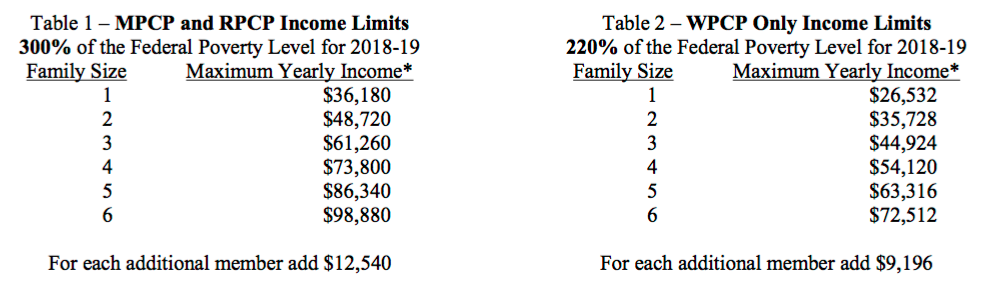
Not just anyone can participate in school choice programs. Wisconsin’s programs are income-limited, meaning that families must earn below a certain amount of money to participate. While families earning up to 300% of the federal poverty line can participate in Milwaukee or Racine-area parental choice programs, families outside of those cities can only earn up to 220% of the federal poverty line before being deemed “too rich” to participate. What do you think about these income limits?
Questions for Discussion
- Take a look at data for your local school and district. Do the results surprise you? Why or why not?
- How should states approach the question of funding public education? Should public tax dollars follow a child to the education that best fits his or her needs?
- Should regulations on school choice programs, such as income limits and enrollment caps, be expanded or pulled back? Why?
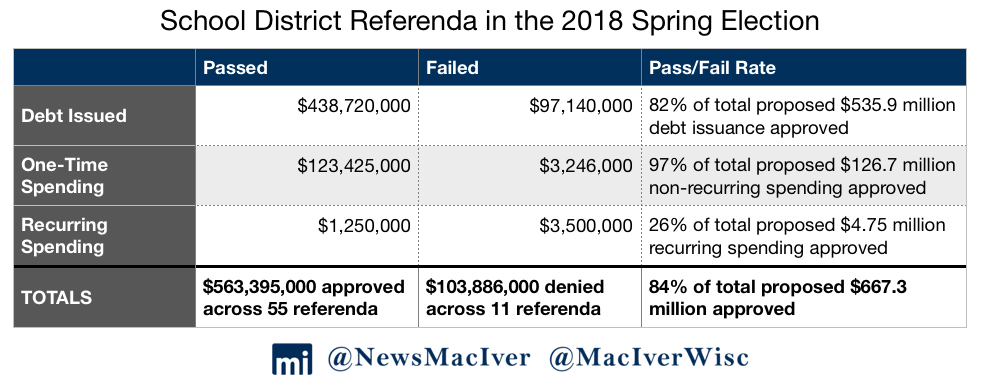
- School districts have increasingly turned to referenda to finance various projects. Is this concerning to you? Why or why not? How should the questions of local control and statewide property tax levies be balanced? While they are local decisions, referenda impact taxpayers around the state. If a district up north raises taxes by millions of dollars, that increases the state spending base and has a direct impact on homeowners even down in Waukesha who do not have a say in such decisions.
- Should schools and districts make college acceptance and participation the primary goal for their graduates?
- Given the emerging technologies, what should a 21st century K-12 education look like?
- How do we effectively deal with K-12 funding in an age of declining or stable enrollment?
- Should neighboring school districts seek more consolidation and education partnership opportunities?
- What do we need to do to prepare students for the workforce ready jobs of today and tomorrow, in fields like advanced manufacturing and information services?
More Charts to Spur Discussion
More Charts to Spur Discussion

Further Reading
- wisedash.dpi.wi.gov: The data hub for Wisconsin’s Department of Public Instruction provides almost every education statistic you can think of. Take a look around – does any information surprise you?
- The Nation’s Report Card: NAEP results are the very latest education data available, released on April 10, 2018. Read about how Wisconsin students fared compared to the national average in MacIver’s analysis here.
- MacIver’s State of Education 2017: A roundup of education in the 2017-19 biennial budget, followed by a quick analysis on every major education datapoint available, including graduation rates, ACT scores, AP exam participation, and many others.
- 2017 Report Card Coverage: Read MacIver’s analysis of the 2017 school and district report cards, where more schools were declared failing while zero school districts received failing marks.