Overview
Read on for some statistics and insights about the level of civic engagement, political engagement and a “state of the state” overview of Ohio.
Civic and Political Engagement
According to the Corporation for National and Community Service for 2018:
- 33.2% of residents volunteer, ranking them 23rd among the 50 states and Washington, DC.
- 3,052,430 volunteers
- 278 million hours of service
- $6.7 billion worth of service contributed
Looking at political engagement specifically, according to this 2018 Wallethub.com study, Ohio ranks #30 based on a weighted average across the following metrics:
- Percentage of Registered Voters in the 2016 Presidential Election
- Percentage of Electorate Who Actually Voted in the 2014 Midterm Elections
- Percentage of Electorate Who Actually Voted in the 2016 Presidential Election
- Change in Percentage of Electorate Who Actually Voted in the 2016 Elections Compared with the 2012 Elections
- Total Political Contributions per Adult Population
- Civic Education Engagement, CIRCLE
- Voter Accessibility Policies, Ballotpedia
Sources: Data used to create this ranking were collected from the U.S. Census Bureau, Center for Responsive Politics, Ballotpedia and Center for Information & Research on Civic Learning and Engagement, CIRCLE.
Women in Ohio Politics
As of 2018, there are 23 women legislators in the Ohio House of Representatives, and 6 in the Texas State Senate – for a total of 29 out of 132 seats in both chambers. This equals 22% of the legislature (Source: NCSL).
See how many women serve in Ohio’s executive offices here.
Ohio ranked 24th in women’s equality – based on workplace environment (pay, unemployment and entrepreneurship rate disparity), education environment (education levels and math and reading scores), and political empowerment (disparity in elected offices) (Source: Wallethub).
What color is Ohio?
Ohio “has been a major battleground in recent elections due to the closeness of the vote and its wealth of electoral votes (currently 18). This was particularly true in 2004, when Ohio put George W. Bush over the top in a close 2 percent victory over John Kerry. 2016 saw Donald Trump defeat Hillary Clinton by over 8 points, the largest margin there since 1988” (270towin).
State of the State
State Government Structure
There are 132 total seats in the Ohio state legislature: the Ohio House of Representatives has 99 members, and the Ohio State Senate has 33. After the 2016 election, Ohio became a Republican state government trifecta, meaning that a single political party (in this case the Republican party) holds the governorship, a majority in the state senate, and a majority in the state house.
Each member of the state house represents an average of 116,530 residents, as of the 2010 Census. In every even-numbered year, all the seats in the house are up for reelection. Ohio state senate members are limited to two consecutive four-year terms. Each senator represents an average of 349,591 residents, as of the 2010 Census (Ballotpedia).
Budget Process
The state operates on a biennial budget cycle. The sequence of key events in the budget process is as follows:
- Budget instruction guidelines are sent to state agencies in July of the year preceding the start of the new biennium.
- State agencies submit their requests to the governor in September and October.
- Agency hearings are held in October and November.
- The governor submits his or her proposed budget to the state legislature in February (this deadline is extended to mid-March for a newly-elected governor).
- The legislature typically adopts a budget in June. A simple majority is required to pass a budget. The biennium begins July 1 of odd-numbered years.
Ohio is one of 44 states in which the governor has line item veto authority.
The governor is legally required to submit a balanced budget proposal. Likewise, the state legislature is legally required to pass a balanced budget (Ballotpedia).
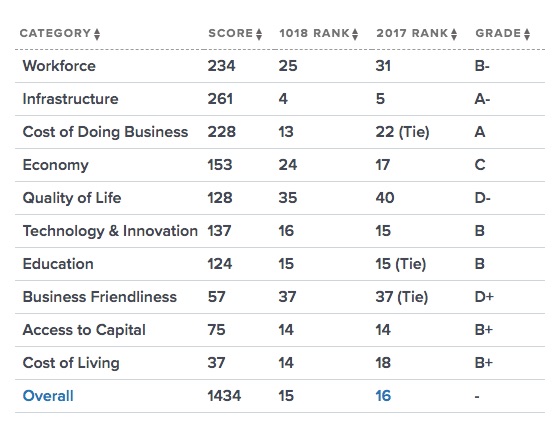
Business Climate
A 2018 CNBC study ranks Ohio #15 in terms of overall business climate:
Freedom
Ohio ranks 25th in Cato Institute’s 2018 Freedom in the 50 states. The overall freedom ranking is a combination of personal and economic freedoms.
Additional Resources
- PEW Fiscal 50: State Trends and Analysis
- PEW Women in Leadership – see analysis of women in leadership on a national scale
- National Association of State Budget Officers (NASBO) Fiscal Survey of States
- Compare 50 – pick what stats you want to compare with what states here
- State Data Lab – compare a variety of factors among states here
- Freedom in the 50 States 2018 – Cato
- Tax Foundation facts and figures app is available for download
What You Can Do
As detailed above, Ohioans have expansive potential for engaging in civic-minded and fiscally responsible activity. By forming Policy Circles across the state, women can lead the way in ensuring that policies are working and responding to individual needs at the local level.
Here’s what you can do:
- Click “It’s easy, start now” at www.thepolicycircle.org to start a circle in your area.
- Read our “Year of Conversation” for an overview of policy briefs on key issues affecting the country and your state.
- Connect with The Buckeye Institute, your state think tank and best resource for state level information on key policy issues.
- Tell a friend or family member about The Policy Circle by sending them to www.thepolicycircle.org. Any woman who believes in the power of free markets to unleash human creativity can start a Policy Circle in her area.