Overview
Read on for some statistics and insights about the level of civic engagement, political engagement and a “state of the state” overview of Washington.
Civic and Political Engagement
According to the Corporation for National and Community Service for 2018:
- 35.7% of residents volunteer, ranking them 17th among the 50 states and Washington, DC.
- 2,086,604 volunteers
- 202.2 million hours of service
- $4.8 billion worth of service contributed
Looking at political engagement specifically, according to this 2018 Wallethub.com study, Washington ranks #5 based on a weighted average across the following metrics:
- Percentage of Registered Voters in the 2016 Presidential Election
- Percentage of Electorate Who Actually Voted in the 2014 Midterm Elections
- Percentage of Electorate Who Actually Voted in the 2016 Presidential Election
- Change in Percentage of Electorate Who Actually Voted in the 2016 Elections Compared with the 2012 Elections
- Total Political Contributions per Adult Population
- Civic Education Engagement, CIRCLE
- Voter Accessibility Policies, Ballotpedia
Sources: Data used to create this ranking were collected from the U.S. Census Bureau, Center for Responsive Politics, Ballotpedia and Center for Information & Research on Civic Learning and Engagement, CIRCLE.
Women in Washington Politics
As of 2018, there are 36 women legislators in the Washington House of Representatives, and 19 in the Washington State Senate – for a total of 55 out of 147 seats in both chambers. This equals 37.4% of the legislature (Source: NCSL).
See how many women serve in Washington’s executive offices here.
Washington ranks 9th in women’s equality in 2018 – based on workplace environment (pay, unemployment and entrepreneurship rate disparity), education environment (education levels and math and reading scores), and political empowerment (disparity in elected offices) (Source: Wallethub).
What color is Washington?
Washington has 12 electoral votes. According to 270towin, “The state has gone through periods during which it voted primarily Democratic and other periods where Republicans usually won. Democrats have been the victors in the last eight elections, making it one of the more reliably blue states at this point in its history. In 2016, Hillary Clinton defeated Donald Trump by a 54% to 38% margin. The state’s electoral influence has grown in recent decades; in the western half of the country only Texas and California have more than Washington’s 12 electoral votes.”
State of the State
State Government Structure
The Washington State Legislature is the state legislature of Washington. It is bicameral, made up of the Washington House of Representatives and the Washington State Senate. After the 2016 elections, Washington became a Democratic state government trifecta, meaning that a single political party (in this case the Democratic party) holds the governorship, a majority in the state senate, and a majority in the state house.
The Washington State Senate has 49 senators, who serve four-year terms without term limits. Each senator represented an average of 137,236 residents, as of the 2010 Census. There are 98 representatives in the Washington State House, elected for two-year terms without term limits. Each member represented an average of 68,617 residents, as of the 2010 Census (Ballotpedia).
Budget Process
The state operates on a biennial budget cycle. The sequence of key events in the budget process is as follows:
- Budget instruction guidelines are sent to state agencies in April.
- State agency budget requests are submitted in September.
- The governor submits his or her proposed budget to the Washington State Legislature on or before December 20.
- The legislature adopts a budget in April or May. A simple majority is required to pass a budget.
- The biennial budget cycle begins in July.
Washington is one of 44 states in which the governor has line item veto authority.
The governor is required by statute to submit a balanced budget to the legislature. Though the legislature is not required to pass a balanced budget, state law does forbid expenditures without supporting revenues (Ballotpedia).
Business Climate
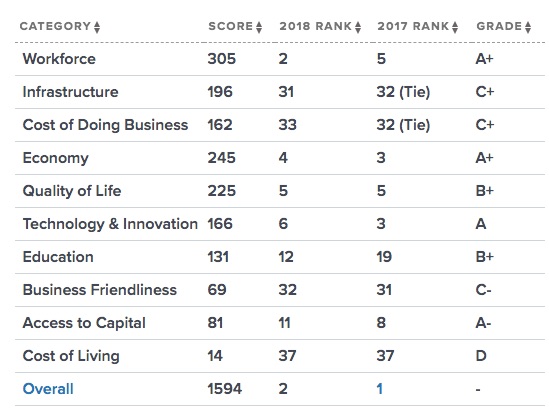
A 2018 CNBC study ranks Washington #2 in terms of overall business climate:
Freedom
Washington ranks #36 in Cato Institute’s 2018 Freedom in the 50 states. The overall freedom ranking is a combination of personal and economic freedoms.
Additional Resources
- PEW Fiscal 50: State Trends and Analysis
- PEW Women in Leadership – see analysis of women in leadership on a national scale
- National Association of State Budget Officers (NASBO) Fiscal Survey of States
- Compare 50 – pick what stats you want to compare with what states here
- State Data Lab – compare a variety of factors among states here
- Freedom in the 50 States – Cato
- Tax Foundation facts and figures app is available for download
What You Can Do
As detailed above, Washingtonians have expansive potential for engaging in civic-minded and fiscally responsible activity. By forming Policy Circles across the state, women can lead the way in ensuring that policies are working and responding to individual needs at the local level.
Here’s what you can do:
- Click “It’s easy, start now” at www.thepolicycircle.org to start a circle in your area.
- Read our “Year of Conversation” for an overview of policy briefs on key issues affecting the country and your state.
- Connect with Washington Policy Center, your state think tank and best resource for state level information on key policy issues.
- Tell a friend or family member about The Policy Circle by sending them to www.thepolicycircle.org. Any woman who believes in the power of free markets to unleash human creativity can start a Policy Circle in her area.