Have you ever considered where funding for emergency response services come from? Or how hospital locations are determined? Data from the decennial census can play a part in both. Why does the nation need to make this count every ten years? What other information does the Census tell us? How does it affect individuals, communities, businesses, and government?
Introduction
View the Executive Summary for this brief.
Case Study
When Hurricane Irma tore through the Florida panhandle in 2017, few people were probably thinking about the Census. However, when planning evacuation routes, emergency services in Cape Coral, Florida relied on Census data. Census Bureau data provided population maps to emergency response teams, enabling them to identify where to send supplies, where to set up distribution points, where to send wheelchair-accessible vans, and which shelters to direct people towards. Knowing where people live and how many people live there is critical for effective emergency response and allocation of many other types of federal funds.
This proved true again in 2020, when all fifty states were declared federal disaster areas due to COVID-19. The Census Bureau explains, “As each state becomes a disaster or emergency declaration area, real-time data on hurricanes, floods, wildfires, and winters storms were updated but drowned out by the nationwide swath of COVID-19 disaster areas.” The Bureau’s OnTheMap for Emergency Management data tool was initially overwhelmed, and was redesigned so response teams and individual community users could identify specific events, affected areas, and social and economic vulnerabilities in order to plan, respond, and launch recovery measures.
Putting it in Context
History
 In 1790, the Founders included in the Constitution a plan “to count every person living in the newly created United States of America, and to use that count to determine representation in the Congress.” This plan, called the Census, is the once-a-decade population and housing count of all 50 states, the District of Columbia, Puerto Rico and the Island Areas as required by the U.S. constitution.
Why it Matters
Information gathered from the Census is used to allocate over $1.5 trillion in spending, and billions more in private sector investment. This information also drives the redistribution of seats in the House of Representatives, the federal level policymakers closest to their constituents. The population count answers questions from who we are and where we live, to which communities need new schools or roads and what services should be offered based on regional demographics. All of these answers affect the nation at large, as well as each community across the country and its individual residents, businesses, and policymakers. For more on what Census data can show, see the Census Bureau’s America Counts.
How Does it Work?
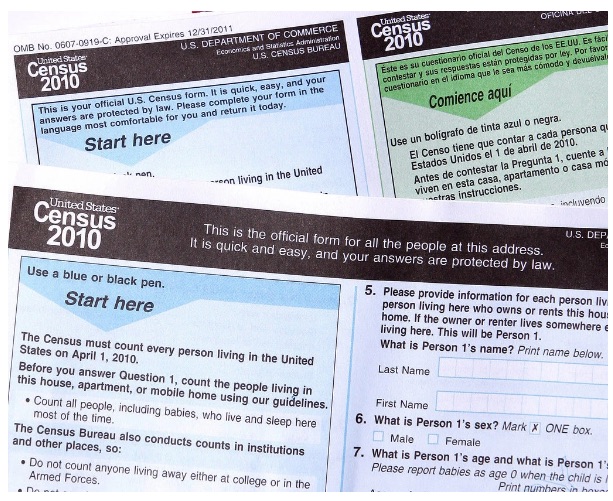
Since 1790, a census of the U.S. population has been conducted every 10 years (and since 1930 has always been conducted on April 1). The most recent Census began on April 1, 2020.
Questions on the Census include general contact information and information on residency, ethnicity, and age. The Census Bureau is required by law to protect individuals’ information, all of which is combined to only be used for statistical purposes. For the 2020 Census, individuals were able to fill out the form online, by mail, or by phone.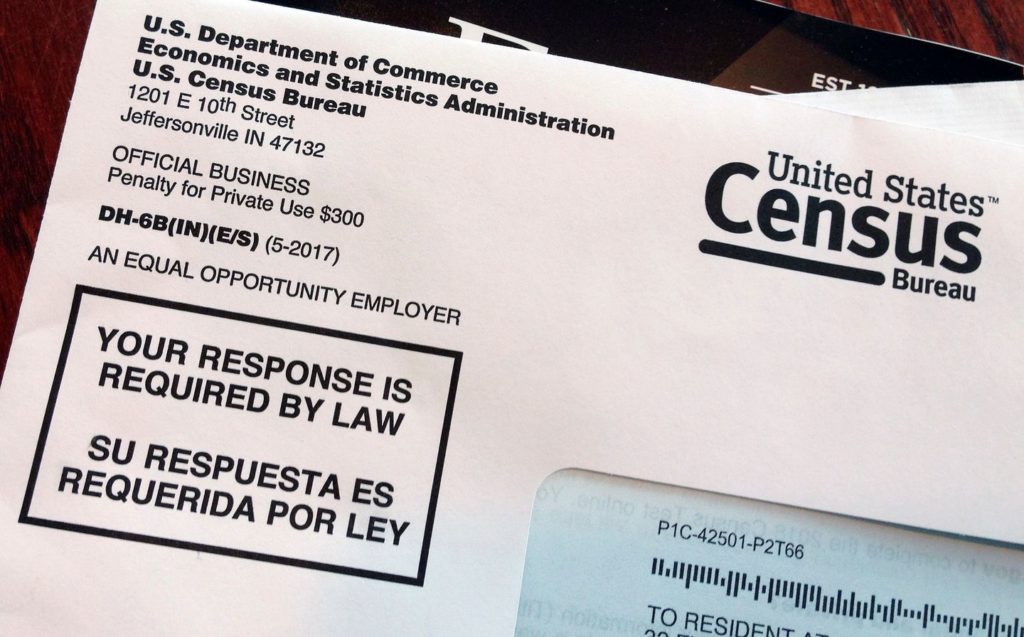
Federal law mandates all households participate in the Census, and any household member over 18 who does not participate can be fined. According to The Hill, “Not completing census forms is a crime under Title 13 of the U.S. Code,” with the exception of not answering based on religious beliefs. Title 13 imposed a $100 fine for refusing to answer census questions and a $500 fine for answering questions falsely. In 1984, however, the Sentencing Reform Act increased the minimum fines to $5,000. The last census failure to be prosecuted was in 1970; census officials usually contact residents who fail to complete census questions to allow them to comply.
The Role of Government
The Census Bureau
According to the Constitution, Congress is responsible for conducting the Census – but this is one of many powers that Congress has delegated back to the executive branch. The Census Bureau, which became a permanent agency under the Department of Commerce in 1902, is now in charge of the census.
The Census Bureau serves “as the nation’s leading provider of quality data about its people and economy” and is “the federal government’s largest statistical agency.” It is overseen by the Commerce Department’s Economics and Statistics Administration. The Census Bureau also conducts an economic census every 5 years; a census for local and state governments every 5 years; annual economic and demographic surveys; and the American Community Survey, which is conducted annually for social, demographic and economic characteristics. Those efforts are smaller in scope than the decennial census. The Bureau additionally makes population and demographic projections based on Census data.
Congressional Committees
The Senate Committee on Homeland Security and Governmental Affairs and the House Committee on Oversight and Reform, specifically the Subcommittee on Civil Rights and Civil Liberties, have legislative and oversight jurisdiction over the Census and the Census Bureau. For example, the Census Bureau needs to submit to Congress the questions that will be on the Census for approval.
What Does it Affect?
We’ve talked about some Census data uses, but there are many more uses we never think about. Census information is used to shape other federal statistical surveys and to generate population projections to be used in economic indices and spending models. Additional public sector uses for census data include promoting economic development and shaping tax policy. In the private sector, businesses frequently use census data to make decisions on investments, marketing, and advertising.
Of course, the two uses we think about the most are allocating federal funds and congressional seats.
Funding
For funding, population counts and characteristics are aggregated and organized by geography (urban/rural, state, county, census tract, block, etc.). For example, “the urban/rural classification is an important part of the U.S. Department of Agriculture (USDA) programs designed to serve rural areas.”
Census Bureau data affect funds in one of three ways:
- Selection of recipients: Census data define the characteristics of populations who become eligible to receive services from specific programs, or characteristics of public or private entities eligible to receive funds to provide those service.
- Allocation of funds: Census data determine how funds are distributed to eligible recipients.
- Assessment of programs: Census data ensure programs function according to plan, and explore potential alternative methods of distributing funds.
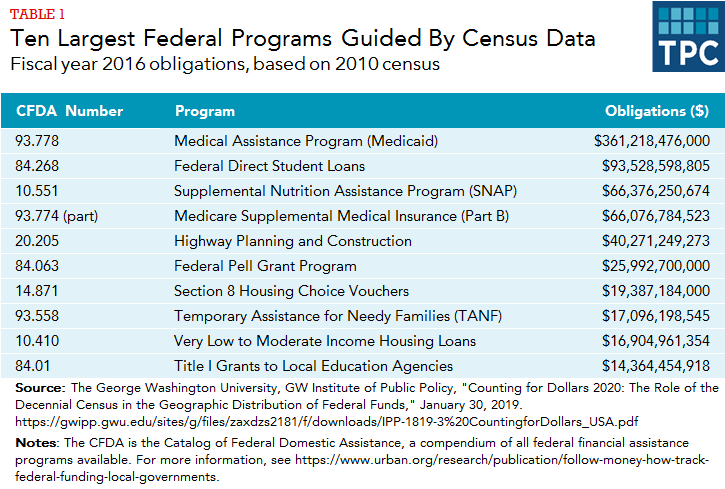
Population counts derived from the Census are also utilized in determining how much money states, counties, and cities receive from the federal government. The George Washington University Institute of Public Policy Counting for Dollars Project 2020 identified 325 census-guided federal spending programs that distributed $900 billion across the U.S. in FY2016.
 The Department of Housing and Urban Development uses measures related to poverty, population, and housing to determine funding for the Community Development Block Grant program. Census data are also used to calculate funding that matches state spending on programs, such as for Temporary Assistance for Needy Families (TANF) and Children’s Health Insurance Program (CHIP). Even our roads and highways are impacted – most states rely on population counts from the census to allocate gasoline sales tax revenue, which is a primary source of funding for local roads.
Electoral Maps
Every decade, population changes measured by the Census are used to redraw the boundaries for House districts and state legislative districts, as well as for school districts and voting precincts. This video explains how the Census is used to divide seats in the House of Representatives among the 50 states:
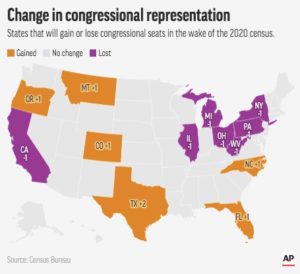
The 2020 Census “will lead to a reapportionment of Congressional Districts. Since each state receives electoral votes equal to its number of congressional seats (+2 for its Senators), the electoral map will be changing for the 2024 presidential election.” Based on broad data released by the Census Bureau in April 2021, 13 states either lost or gained House seats/electoral votes. The largest change is for Texas (gain 2). The other states affected either lost 1 vote (California – for the first time in its statehood – Illinois, Michigan, New York, Ohio, Pennsylvania, and West Virginia) or gain 1 vote (Colorado, Florida, Montana, North Carolina, and Oregon). One or two votes may not seem significant for larger states like Florida (which increased from 27 votes to 28), but it can make a dramatic difference for smaller states, like Montana (which increased from 1 vote to 2). For more, see The Policy Circle’s Electoral College Deep Dive.
Current Challenges and Areas for Reform
The Census only happens once every ten years, so getting full participation is of the utmost importance. Participation is mandated by law, but misinformation spreading on social media, concerns about data privacy, and ensuring participation in hard-to-reach areas are proving to be challenges.
Combating Disinformation
In 2018, rumors on social media spread that census takers looking to confirm addresses were actually robbers scoping out neighborhoods. The Census Bureau implemented a Trust and Safety Team to combat this kind of false claim, and other misleading information about the Census. The new task force partnered with social media sites including Twitter and Facebook, which “have been grappling with repeated attempts by people to use their platforms to create false narratives to sway popular opinion,” particularly during the 2016 election. These companies have the ability to “remove or lower the ranking of content that is considered harmful to the count.” Additionally, the Census Bureau initiated a $500 million communications campaign to supply facts to counter any false claims and educate people on how the population count works and what it entails.
Protecting Data
In 2018, the Census Bureau discovered anyone with the proper data tools could use 2010 Census statistics to identify one in six Americans. Researchers rearranged the billions of statistics from the 2010 Census, linked the partial identities to a commercial database with names, and successfully identified 52 million Americans.
The Census Bureau exists “to share as much useful data as possible” with businesses and government agencies so they can use the data for reasons such as research and projections. However, the Census depends on Americans trusting the government to keep the personal information they report safe. In addition to the federal laws that protect data collected by the Census from any other use, even in court, the Census Bureau has taken steps to prevent identification of specific households and individuals. For more information, see these explainers from the Census Bureau on federal law regarding the confidentiality of your census responses and the safety of your data.
Ensuring Participation
California is one state concerned about undercounting, and budgeted $187 million on a campaign to get its 40 million residents to participate in the 2020 Census. This included custom marketing campaigns and partnerships with nonprofit organizations that have been “showered with grants to boost response in hard-to-count areas.” In rural California, for example, where lack of internet service can impede responses, efforts focused on community events and using billboards. About half the states allotted close to $300 million for similar census campaigns.
The other half of the states were more like Texas (with 29 million residents, second in population behind California), where “a volunteer corps of civic groups, philanthropies, local governments, and others” tried to reach those who may be undercounted. The Texas Legislature failed to pass a bill that would have committed $50 million to census response efforts. For many of these states, efforts provided by the private sector filled gaps in tight state budgets.
Data released by the Census in March 2022 showed that the total population count was consistent with that of previous censuses, meaning that Census outreach efforts were successful in spite of barriers caused by the coronavirus pandemic. However, the 2020 Census also undercounted the same populations groups that have historically been undercounted. Results from the Post-Enumeration Survey (PES) and the Demographic Analysis Estimates (DA) detail how well the census counted the population and specific demographic groups; results showed the 2020 Census “undercounted the Black or African American population, the American Indian or Alaska Native population living on a reservation, the Hispanic or Latino population, and people who reported being of Some Other Race.” The 2020 Census also undercounted children 0 to 17 years old, and in particular children ages 0 to 4.
The Citizenship Question
The Commerce Department under the Trump administration wanted to ask a citizenship question on the 2020 Census, which created quite a bit of turbulence. Three courts blocked the admittance of such a question to the Census, which then went to the Supreme Court Justices. On June 27, 2019, the Supreme Court agreed with the lower courts in a 5-4 decision.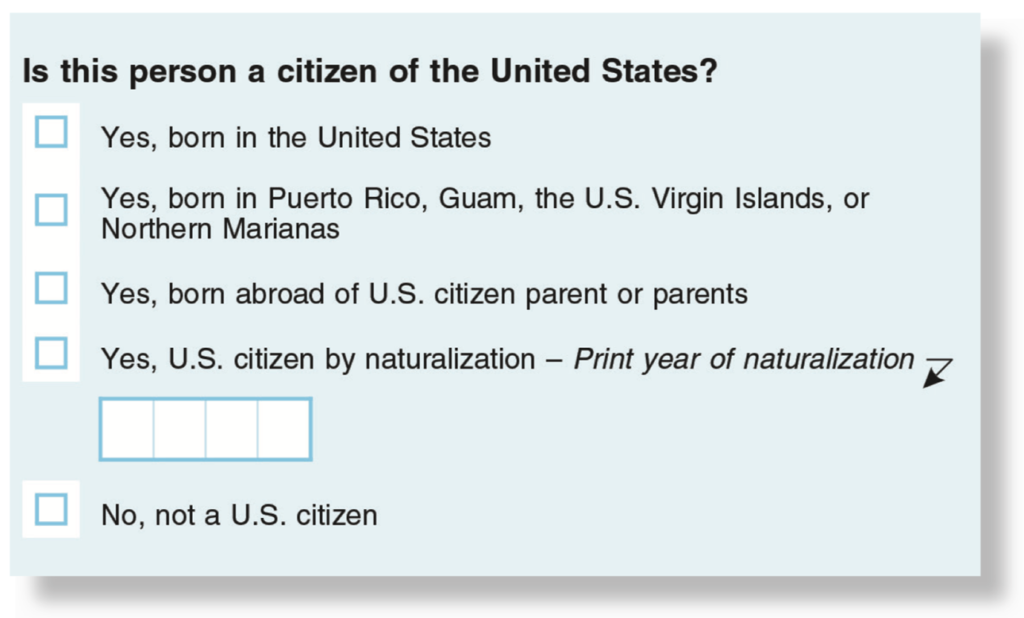
Simply put, the question would have asked whether or not the respondent is a citizen of the United States. It would not have asked about legal status. The Census used to ask a citizenship question, but switched things up in 1950 when the Census Bureau began distributing two different census forms, a long one and a short one. Only the long one contained the citizenship question, but only one in six households received the long form, which has not been used since 2000. The question now appears instead on the American Community Survey, an annual survey the Census Bureau sends to a random sample of 3.5 million households for yearly information on economic, social, demographic, and housing data such as income, poverty, and health insurance. This move would have taken the same question from the American Community Survey and put it on the Census instead.
When considering this approach, the Department of Commerce noted Australia, Canada, France, Germany, Indonesia, Ireland, Mexico, and the UK all ask a citizenship question on their census questionnaires. Mixed feelings about the citizenship question arose in test settings in 2017, when Census Bureau interviewers reported confidentiality and data-sharing concerns when they asked questions about citizenship. Interviewers said some survey respondents (particularly immigrants or those living with immigrants) provided incomplete or incorrect information and were visibly nervous.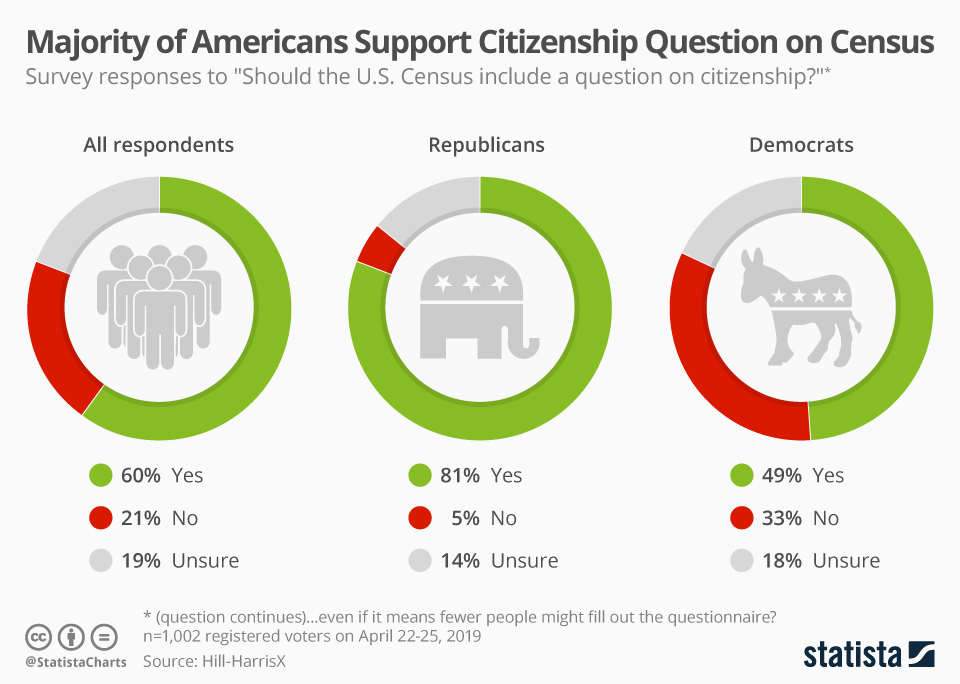
Critics argued a citizenship question would “deter immigrants from taking part in the population count for fear of deportation…to engineer a deliberate undercount of places with high immigrant and Latino concentrations.” If this reasoning is correct, including the question would result in communities with large immigrant populations receiving less political representation and government funding. At the same time, not responding to the Census violates federal law. Thus, these potential injuries would technically occur only if respondents violated the law.
For more on the citizenship question, listen to this Constitution Center debate between Tom Wolf and John Eastman.
Redistricting
Redistricting is “the process by which new congressional and state legislative district boundaries are drawn.” Every ten years, the states use Census data to redraw districts used to elect members of the U.S. House of Representatives and of state legislatures. The way districts are drawn “can influence who wins elections, how political power is distributed, which communities are represented and what laws are passed.”
How are districts drawn?
There are no constitutional requirements dictating how the states go about redistricting, but mid-1960s Supreme Court rulings clarified state redistricting standards. For example, in Wesberry v Sanders (1964) the Supreme Court ruled “that the populations of House districts must be equal ‘as nearly as practicable.’” Today it is generally accepted that a redistricting plan “‘will be constitutionally suspect if the largest and smallest districts [within a state or jurisdiction] are more than 10 percent apart.’”
Other criteria among states include:
- Contiguity, “the rule that electoral districts in a state be physically adjacent.”
- Required for congressional districts in 23 states and for state districts in 49 states
- Compactness, “the principle that the constituents residing within an electoral district should live as near to one another as possible… For example, Iowa requires that districts not be oddly shaped; California require districts not to bypass nearby populated areas in favor of more distant populated areas.”
- Required for congressional districts in 18 states and for state districts in 37 states
- Consistency with natural and political boundaries, meaning “the boundaries of other governments, such as cities, towns, or counties, and political divisions, such as city council wards or state legislative districts” are taken into account when drawing electoral districts “to keep existing constituencies within one district.”
- Required for congressional districts in 19 states and for state districts in 42 states
- Community of interest, a “group of people with a common set of concerns that may be affected by legislation… Some states require that the preservation of communities of interest be taken in account when drawing electoral districts in an effort to enable these communities to elect representatives whose platforms or policy proposals align with their interests.”
- Required for congressional districts in 13 states and for state districts in 24 states
See criteria in your state, from the National Conference of State Legislatures.
Competitiveness is sometimes another aspect, “with the goal of creating districts that will be as evenly split in two-party partisanship as possible,” but it is also highly controversial because it requires whoever draws the lines “to actively consider the impact of the districts on electoral outcomes.” More often, whoever draws the lines is explicitly forbidden from considering partisanship data like voting history or voter registration.
Another consideration is majority-minority districts. The Voting Rights Act of 1965 mandates “that electoral district lines cannot be drawn in such a manner has to ‘improperly dilute minorities’ voting power.’” In majority-minority districts, “a racial or language minority group comprises a voting majority.” Advocates say this reduces cracking, “when a constituency is divided between several districts in order to prevent it from achieving a majority in any one district.” Critics say it can also result in packing, “when a constituency or voting group is placed within a single district,” which essentially consolidates votes into a smaller number of districts and minimizes the influence in other districts.
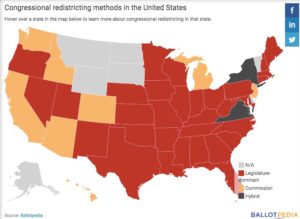
Who draws districts?
- In 33 states, state legislatures are in charge of congressional redistricting. In some cases, a commission makes recommendations but the state legislature has the final say.
- In 8 states, commissions draw the congressional district maps. These can be bipartisan commissions made up of legislators, or independent commissions.
- In 2 states, the state legislatures share redistricting authority with commissions in hybrid systems.
- The remaining states only have one congressional district each.
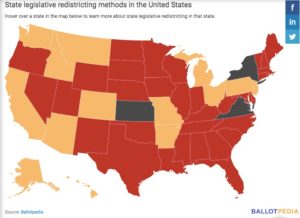
- In 33 states, state legislatures are in charge of state legislative redistricting.
- In 14 states, commissions draw state legislative districts.
- In 3 states, state legislatures and commissions share redistricting authority in hybrid systems.
Gerrymandering
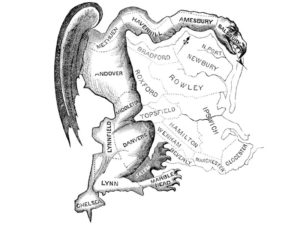 Gerrymandering is “the practice of drawing electoral district lines to favor one political party, individual, or constituency over another.” The nation’s history is full of examples of lawmakers redrawing electoral district maps in such a way that gives their respective parties more electoral power. Historians have evidence indicating Patrick Henry was actually the first to draw an unnaturally shaped district to ensure victory over James Madison in Virginia’s first congressional elections in 1789, but the actual term gerrymandering comes from Massachusetts Governor and Founding Father Elbridge Gerry, who in 1812 signed a controversial redistricting bill that turned one Massachusetts district into a salamander-like shape.
Election reformers say state legislatures redraw districts “to cement their grip on power and dilute the voting power of people who support the rival party,” which affects voting rights. Another argument is that there is no way to reliably identify partisan gerrymandering, nor is there a single way to correct gerrymandering. The Supreme Court cited this argument on June 27, 2019, when it ruled against challengers opposing partisan gerrymandering in a 5 to 4 vote, explaining that “partisan gerrymandering claims present political questions that fall beyond the jurisdiction of the federal judiciary.” Chief Justice John G. Roberts Jr. wrote, “…the fact that such gerrymandering is ‘incompatible with democratic principles,’ does not mean that the solution lies with the federal judiciary…judges have no constitutional authority to impose restrictions on lawmakers.” For more redistricting cases that have come before the Supreme Court, see this National Council of State Legislature’s compilation.
This means the Constitution does not grant federal judges the authority to set limits on how states draw electoral maps. This has led to calls for reforming how states draw districts, particularly diminishing the authority of state legislatures. Ideas include:
- Criteria-Driven Civil Servant Approach, modeled on Iowa. District maps are drawn by nonpartisan bodies of civil servants, and the state legislatures vote to adopt the maps without amendments.
- Criteria-Driven Independent Commission Approach, modeled on California. A citizen commission draws district maps in an effort to maximize citizen participation.
- Bipartisan Commission, modeled on New Jersey. A Bipartisan commission draws the map.
- Legislative Redistricting with Public Input and Transparency, modeled on Idaho. The state legislature adopts the districting maps, but allows the public to submit plans, makes plans available to the public, and requires all meetings and hearings to be open to the public.
- The Public Mapping Project is an online tool that allows the public to draw the boundaries of their communities and generate redistricting plans for their state.
See more of what redistricting looks like in every state with this map from 538. See more detailed demographic data from the 2020 Census here.
Conclusion
The Census is responsible for guiding hundreds of billions of dollars in public and private spending and investment as well as political representation. As participants, Americans need to know the purposes and importance of the Census, and officials must ensure their responses are counted and remain private. This nation-wide endeavor requires the combined efforts of individuals, communities, businesses, and government since the results affect each and every one of these stakeholders.
Thought Leaders and Additional Resources
- How undercounting could affect schools, US News
- How citizenship is tied to Public Benefits, Immigration Forum
- How citizenship is tied to taxes, Bipartisan Policy Center
- Redistricting Online, from the National Conference of State Legislatures and New York Law School
- Professor Justin Levitt’s Guide to Drawing Electoral Lines (Loyala Law School)
- Ballotpedia’s state-by-state redistricting procedures and news on the 2020 Census
- FiveThirtyEight’s What Redistricting Looks Like in Every State
Ways to Get Involved/What You Can Do
Measure: Find out what your state and district are doing about the Census and its results.
- Do you know how the Census affects your community or state?
- The Census Bureau’s QuickFacts provides statistics for states and counties.
- What are your state’s criteria on redistricting? Who is in charge of redistricting?
Identify: Who are the influencers in your state, county, or community? Learn about their priorities and consider how to contact them, including elected officials, attorneys general, law enforcement, boards of education, city councils, journalists, media outlets, community organizations, and local businesses.
- What coordinating and affiliate agencies in your state work in partnership with the Census Bureau?
- What steps have your state’s or community’s elected and appointed officials taken?
- Find your representative and look at district boundaries with GovTrack’s Congressional Districts Map.
Reach out: You are a catalyst. Finding a common cause is a great opportunity to develop relationships with people who may be outside of your immediate network. All it takes is a small team of two or three people to set a path for real improvement. The Policy Circle is your platform to convene with experts you want to hear from.
- Find allies in your community or in nearby towns and elsewhere in the state.
- Everyone is impacted by the Census. Foster collaborative relationships with law enforcement, first responders, faith-based organizations, local hospitals, community organizations, school boards, or local businesses.
Plan: Set some milestones based on your state’s legislative calendar.
- Don’t hesitate to contact The Policy Circle team, communications@thepolicycircle.org, for connections to the broader network, advice, insights on how to build rapport with policy makers and establish yourself as a civic leader.
Execute: Give it your best shot. You can:
- Find active organizations in your community.
- Educate yourself and others on how redistricting works with Ballotpedia or the National Conference of State Legislatures.
- Search “Census” on your state government homepage to see which committees or agencies in your state and community are involved with the Census.
- Find out how many electoral votes and representatives your state has, and how that might change.
- Keep up to date with data from the 2020 Census with Ballotpedia or Redistricting Online.
- Try your hand at drawing a redistricting plan for your state with the Public Mapping Project.
Working with others, you may create something great for your community. Here are some tools to learn how to contact your representatives and write an op-ed.