
Introduction
View the Executive Summary for this brief.
Case Study
For decades, the quintessential vision of an “American Dream” began with a home. That vision differs based on personal interest, culture, employment, and desired community amenities; ranging from a downtown high-rise apartment to a white picket fence in the suburbs to everything in between and beyond the city lights.
The Manhattan Institute found the price tag for the American Dream costs more than ever before:
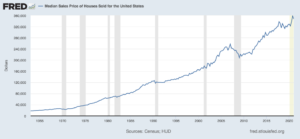
The prices of newly built, detached, single-family homes in the U.S. have increased more than twice the rate of inflation over the last two decades. In 2000, the median price for a newly built, detached, single-family house in the U.S. was just $172,000. By 2020, that figure had soared to $336,900, an increase of nearly 96%. Over the same period, inflation as measured by the personal consumption expenditures (PCE) deflator was just 42%. Rents have also increased faster than inflation, and from February 2021 to February 2022 went up by more than 20% nationally.
The cost of housing, both homeownership and renting alike, is addressed by local and national policy. Is there a significant cost difference between renting and owning a home? Actually, no; the gap is quite small. iPropertyManagement reports the total monthly housing costs are $1,510 for homeowners and $1,301 for renters. The mere $200 difference indicates that renters do not receive a cost advantage over owning and may prefer to rent over the financial risk of buying. 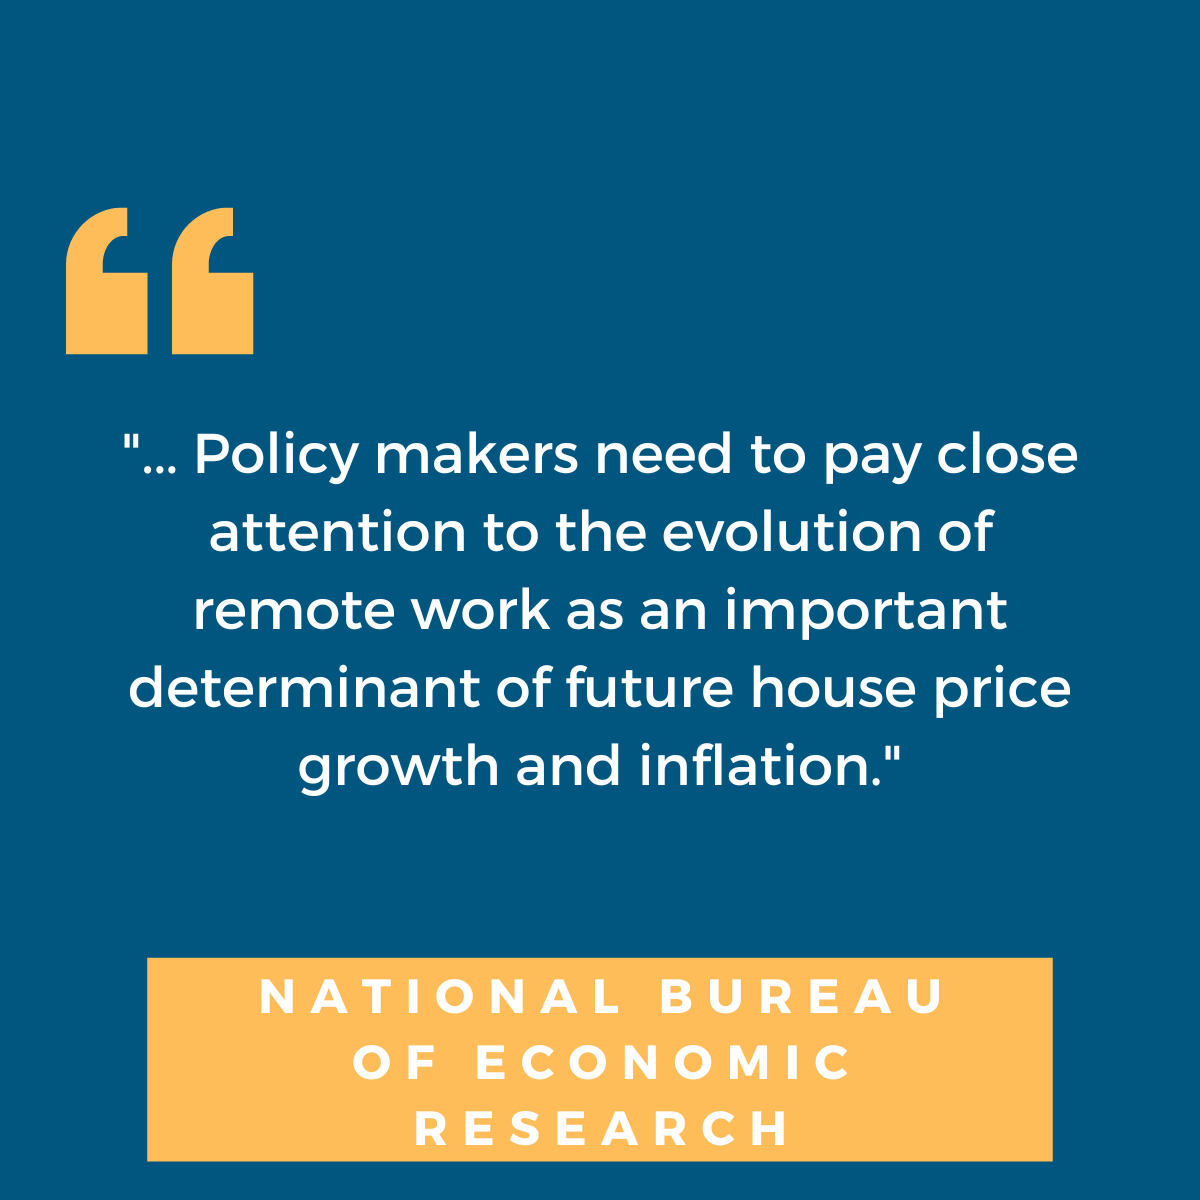
The long-term impact this has on the U.S. economy is in question. COVID-19 pandemic policy implementation by state and local governments impacted what people want from where they live. Response to the pandemic laid bare people’s interest to remain in place or uproot entirely and move elsewhere; also thanks, in large part, to the availability of remote work.
Why it Matters
Homeownership has long been considered part of the American dream. The federal government has historically passed substantive legislation to address affordable housing measures, provide tax incentives to private developers, and tasked states to increase housing infrastructure.
However, many low-income earners cannot afford homeownership without tax credit or income supplement, and middle-income earners find homeownership increasingly unaffordable.
The Housing Act of 1949 declared housing an issue of “general welfare and security of the Nation” and expressly connected housing production with community development. The three main objectives to adequately address housing in the US included the following:
- Sufficient development to remedy the housing shortage
- Eliminate substandard housing
- Help every American family realize the goal of a decent home and suitable living environment
Congress recognized that housing advances economic growth, both locally and nationally, and enhances the Nation’s wealth and security. Criticism of the act claims it failed by disproportionately displacing a significant portion of city residents by destroying urban areas without providing more adequate housing options. One example occurred in Boston’s West End.
Even though the 14th Amendment of the U.S. Constitution guarantees equal protection under the law for each citizen and prohibits states from denying any person “life, liberty, or property…nor deny to any person within its jurisdiction the equal protection of the laws,” many cities and expanding suburb developers instituted discriminatory policies to limit housing access to minorities.
For a discussion of how discriminant housing policy has disproportionately affected low-income and minorities, watch this video with the author of “The Color of Law,” Richard Rothstein.
The housing market constitutes a significant part of the U.S. economy. According to the National Association of Home Builders, housing contributes, on average, 15-18% of the country’s Gross Domestic Product (GDP). In 2021, housing was 16.4% of GDP. Simply constructing 100 units of single-family housing supports over 200 full-time jobs and produces over $11 million in wages.
As policy reforms continue to encompass historic inequities that aim to address past wrongs and more equitably move forward, housing policy is a foundational part of the conversation. Quite simply, every person needs a place to live. The notion that many working Americans cannot afford suitable housing, with homeownership being even harder to attain, rocks the idyllic image of the American dream.
Is Renting more attainable than Homeownership?
“The median asking rent for an apartment completed in the second quarter of 2021 was $1669, and a renter would need to earn at least $66,760 to afford such a unit. MIHTC would make housing more affordable and available to middle-income Americans.” – Matthew Berger, National Multifamily Housing Council
According to a March 2022 poll by Bankrate, homeownership remains a pivotal part of the American Dream and the landmark of “economic stability,” beating a college education and a successful career. However, 43% of poll participants indicated the main barrier to homeownership is “not enough income,” with high prices a close second at 39%.
The National Association of Home Builders (NAHB) finds one-third of U.S. households pay more than 30% of their income towards housing. This number includes owners and renters alike. Affordability calculations include insurance. The cost difference between homeowners insurance and renters insurance is significant enough to deter homeownership.
- Under 35:
- 65% are renters
- 38.1% are homeowners
- 35-44: 62% are homeowners
- 45-54: 69.4% are homeowners
- 55-64: 75.7% are homeowners
- 65+: 79.3% are homeowners
- Median age of homebuyers: 47
- Median age of renters: 38
While homeownership continues to be a desirable milestone for Americans 26 years old and older, recent trends indicate its less economically feasible for younger American households and more attainable later in life.
Putting it in Context
History
Housing is primarily a private market enterprise, but the government has grown increasingly involved over the past century. During the Great Depression, the economy hit a standstill; banks had minimal capacity to make loans to finance housing purchases, so the federal government implemented new efforts with President Roosevelt’s New Deal to stimulate growth.
The government programs included the Federal Housing Association in 1934 to reduce the risk associated with lending and protect lenders in the case of borrower default, and the Federal National Mortgage Association (“Fannie Mae”) in 1938 to “stimulate the housing market by making more mortgages available to moderate- and low-income borrowers.”
The Rise of Homeownership
After the end of WWII through the 1960s, homeownership rose from 45% to 60%. The steep increase is attributed to the rise of suburbs, the baby boom, low interest rates, and extended loan periods like a 30-year mortgage.
The 1970s marked a surge in homeownership as the Baby Boomer generation grew older and demanded a greater supply of larger, more expensive homes. To finance the new demands, Congress created the Federal Home Loan Mortgage Corporation (“Freddie Mac”) in 1970 to increase the amount of available capital.
Throughout the 1980s and 1990s, Congress enacted reforms to increase American homeownership. The Community Reinvestment Act of 1977 (CRA) aimed to address “limited credit availability” by allowing mortgage lenders “to buy ‘subprime’ securities to fulfill their affordable-housing lending obligations.” In plain terms, the CRA prompted lenders who accepted capital from lower-income neighborhoods but failed to extend credit to creditworthy consumers in the same neighborhoods.
Many economists believe the eased credit requirements increased the demand and use of risky subprime loans. The result was millions of prospective homebuyers were issued loans valued well above their payment ability, creating the perfect storm for a housing crisis.
The 2008 Housing Crisis
The housing industry began to implode with the decline of housing prices in 2006, culminating in 2008 when the housing bubble burst. Homeowners with subprime mortgages could no longer pay their loans and were forced to default. In many cases, mortgages exceeded the home’s actual value, which meant selling the house to pay back the loan was not a viable option, and borrowers were better off defaulting.
Professor Tyler Cowen of George Mason University explains the intertwining housing factors that led to The Great Recession of 2008 (13 min):
Housing prices that dropped starting in 2006 reversed course and restarted to climb again around 2010. The rise was pressured by a significant decline in available housing for a growing population. A report from the National Association of Realtors suggests that between 2010 and 2020, new home construction “fell 6.8 million units short of what was needed to meet household-formation growth and replace units that were aging or destroyed.”
The Coronavirus Pandemic
Many Americans laid off during the pandemic faced economic hardship, prompting federal, state, and local protections from eviction and foreclosure. Other Americans moved out of large, congested, and expensive urban areas and flocked to areas with more space. According to the Wall Street Journal, the most significant inventory drops occurred in vacation destinations such as Cape Cod and towns just beyond the inner ring of suburbs outside major cities. Meanwhile, inventory in several major cities such as Los Angeles, New York City, San Francisco, Seattle, and Boston, increased.
Additionally, “[p]ublic health guidance to shelter at home during the pandemic underscored the direct relationships between health and housing.” These events have led to “an increased awareness of housing as a core social determinant of personal health and well-being” and one that “is essential for people to address their challenges and pursue their goals.
See The Policy Circle’s Migration Between States Brief for more on where Americans have been moving.
By the Numbers
Homeownership
The housing market in the United States has rebounded since 2008. Home foreclosure rates dropped from over 2% (2009-2010) to under 0.5%. Recent data indicate foreclosure rates plummeted during the pandemic and returned to pre-pandemic levels in 2022. Home sales have improved since 2008; in 2020, the combined number of homes sold was 6.5 million, the highest figure since 2006. However, the supply of homes has not been keeping up with demand; in January 2022, the number of active housing listings in the U.S. dropped to its lowest in five years, a 60% decrease since February 2020.
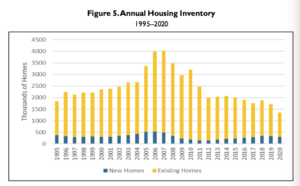
New home sales are related to housing starts, which increased after the financial crisis but are still lower than historical averages. The low inventory is driven by shortfalls in construction due to the availability and costs of land, labor, and materials such as lumber.
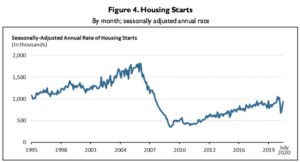
New housing construction remains below the levels necessary to meet demand, and construction costs have increased. Among existing homes, supply is not keeping up with demand. In the rental market, the vacancy rate stood at 5.6% at the end of the second quarter of 2022, from 10% in 2010. The vacancy rate for homeowners’ units held at 0.8% at the end of the second quarter of 2022 from 2.6% in 2010. With fewer vacancies, there are fewer units available.
The price of homes has increased. The national price-to-income ratio was 4.7 in 2019, marking the fourth consecutive year median home sales prices quadrupled the median household income. From 2019 to 2021, the ratio increased to 5.4, meaning homes cost 5.4 times as much as the average annual income. Overall, average rent prices have increased 18% over the last five years, outpacing the 2022 rate of inflation (16%). Nationally, rents rose a record 11.3% in 2021, and —% in 2022.
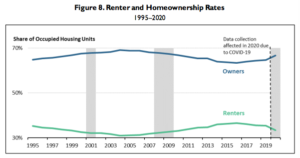
The rise of housing prices indicates a supply-demand problem: too little supply and too much demand, which directly led to an increase in renting. In 2006, renters in major cities totaled 21% and jumped to 47% in 2018.
Total renters increased from 31% in 2005 to 35% in 2019, and fell slightly to 33.4% in 2020. Meanwhile, homeownership stood at 69% in the mid-2000s, fell to 63% in 2016, and slightly climbed to 65.8% in the second quarter of 2022. The slight increase reflects household formation among millennials in their 20s and 30s. Growth in homeownership among households ages 25-34 was:
- 34,000 per year between 2010 and 2013
- 170,000 per year between 2013 and 2016
- 250,000 per year between 2016 and 2019
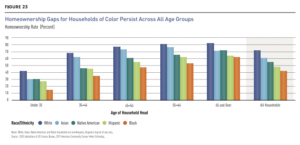
Recent homeownership growth is among households primarily with higher incomes; households with incomes of $150,000 or more, comprised 88% of net homeownership growth between 2013 and 2019. Households with incomes under $75,000, close to the national median income for homeowner households, could afford 46% of the homes on the market in September 2020. In addition to income gaps, homeownership gaps also exist across age groups and races. Data analysis by the National Association of Realtors also supports these findings. According to the United States Census Bureau, in mid-2022, 74% of white adults owned a home, compared with 45% of Black Americans and 48% of Hispanic Americans.
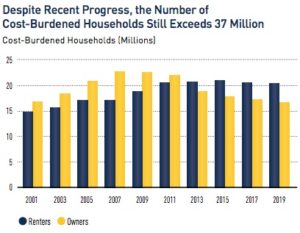
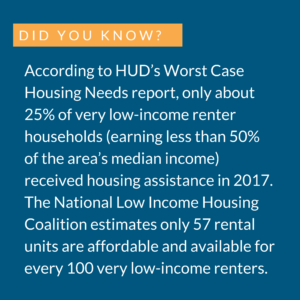
With tight market conditions, decreased supply, and incomes not keeping up with consumer prices, the number of cost-burdened households is increasing. Households that pay more than 30% in housing costs are considered cost-burdened. The number of cost-burdened renters increased from 14.8 million in 2001 to 20.8 million in 2018, representing 47% of all renters even as the total number of renters increased during this time. In 2020, 46% of American renters were cost-burdened, and 23% spent at least half of their income on housing.
About 17 million households are cost-burdened, disproportionately among households under 25 and those over 85. Just under 54% of the 4.4 million households under age 25 are cost-burdened, and almost 37% of 4 million households over age 85 are cost-burdened. Just under 54% of Black households, 52% of Hispanic households, 42% of White households, and 42% of Asian households are cost-burdened.
Homelessness
Evidence indicates that experiencing housing instability or homelessness affects future educational attainment, employment growth, health stability, and family preservation.
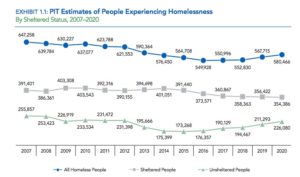
The Department of Housing and Urban Development’s Annual Homeless Assessment Report, released in February 2022, reports that on any given night in 2021, 326,000 people experienced sheltered homelessness nationwide. While homelessness decreased from 2007 to 2020, the number of homeless individuals has steadily increased since 2016. About 60% of the homeless population was in sheltered locations, such as emergency shelters or transitional housing programs, while 40% remained unsheltered.
More than half of all unsheltered homeless persons are in the nation’s fifty largest cities. In fact, California is home to 51% of all unsheltered individuals in the country. More than half of all people experiencing homelessness are concentrated in four states: California (28%), New York (16%), Florida (5%), and Texas (5%). A full 25% of all people experiencing homelessness in the U.S. were either in New York City or Los Angeles.
The typical individual experiencing homelessness is 25 or older (95%), male (70%), and white (54%). Of all people experiencing homelessness, 48% are white (74% of the U.S. population), 39% are Black (12% of the U.S. population), and 23% are Hispanic (16% of the U.S. population).
See state-by-state statistics in HUD’s report (page 70).
The Role of Government
Although housing is foremost a private market enterprise, the government is involved in nearly every aspect of the housing finance market. For example, Congress “establishes laws governing U.S housing policy, funds housing policies and programs via the annual appropriations process and the federal tax code, and oversees policy and program implementation by various federal agencies.”
Federal
Federal Agencies
The Department of Housing and Urban Development (HUD), established as part of President Johnson’s Great Society, “is responsible for national policy and programs that address America’s housing needs, that improve and develop the Nation’s communities, and enforce fair housing laws.” HUD administers the federal government’s main housing assistance programs. In FY2022, HUD’s budget amounted to just under $60 billion.
Regarding housing finance, the Federal Housing Administration (FHA), under HUD, provides mortgage insurance loans to protect lenders against losses if a property owner defaults. FHA is self-funded by insurance premiums it collects from borrowers. Through the Servicemen’s Readjustment Act of 1944, the Department of Veterans Affairs (VA) also administers home loans and other housing-related programs for veterans.
Today, USA Spending says there are 33 federal programs “that explicitly flagged homeless individuals as beneficiaries,” and the United States Interagency Council on Homelessness is the main policy driver. It brings together 19 federal member agencies and “leads national efforts to prevent and end homelessness in America” in cooperation with state and local stakeholders.
The Federal Housing Finance Agency (FHFA), established by the Housing and Economic Recovery Act of 2008, does not receive appropriated funds from Congress. It is responsible for oversight of the Federal Home Loan Bank System.
The Federal Home Loan Bank System is “a government-sponsored enterprise to support mortgage lending and community investment.” It comprises 11 regional banks that are privately capitalized, independently operated, and receive no taxpayer assistance. These banks provide access to billions of dollars in low-cost funding to U.S. banks, credit unions, insurance companies, and community development financial institutions.
The Federal National Mortgage Association (Fannie Mae) and the Federal Home Loan Mortgage Corporation (Freddie Mac) are federally-backed mortgage companies created by Congress. Fannie Mae and Freddie Mac are private companies “even though both have congressional charters that contain special privileges and certain special responsibilities to support affordable for low- and moderate-income households.” Both purchase mortgages from lenders and issue them as government-guaranteed mortgage-related securities. Lenders then have money to originate more loans. Together, they “provide liquidity (ready access to funds on reasonable terms) to the thousands of banks, savings and loans, and mortgage companies that make loans to finance housing.”
In response to losses from the high rate of mortgage defaults in 2008, Fannie Mae and Freddie Mac were placed under conservatorship by the Federal Housing Finance Agency, but for budgetary purposes are not treated as governmental entities. Fannie and Freddie guarantee slightly more than half of the $11 trillion housing market, accounting for 60% of mortgage originations by dollar in 2020.
The Dodd-Frank Wall Street Reform and Consumer Protection Act was in response to the financial crisis of 2007-2008. The Dodd-Frank Act established several new government agencies and offices tasked with overseeing various components of the financial system. Read about the basics of Dodd-Frank here.
Programs
The Housing Act of 1949 officially established the national housing policy goal of providing a “decent home and suitable living environment for every American family.” Today’s federal housing assistance programs are for rental housing assistance (primarily through rent vouchers), assistance to state and local governments (primarily through block grants), and assistance for homeowners (such as through tax incentives or mortgage insurance programs).
The Department of Housing and Urban Development administers the majority of these programs. The following are the largest programs; for others – almost 100, including mortgage and regulatory programs – see this list from HUD.
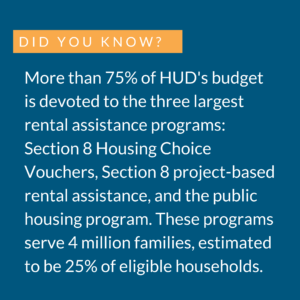
Section 8 Housing Choice Vouchers are a form of tenant-based rental assistance federally funded by HUD and administered locally by Public Housing Authorities (PHAs). Eligible households live in private housing (approved by program standards and with landlords willing to participate). They pay 30% of their adjusted income towards rent, and “the voucher pays the difference between the family’s contribution toward rent and the actual rent for the unit.”
Section 8 is the largest of HUD’s rental assistance programs, accounting for more than one-third of HUD’s budget (amounting to $25 billion in FY2021). According to the latest available data, over two million low-income families participate in the Section 8 program. About 75% of vouchers go to families earning less than 30% of the median area income. In numerical terms, this equates to an annual income of less than $20,000 for most families receiving vouchers in most metropolitan areas.
“Low-rent public housing developments are owned and operated by local public housing authorities (PHAs) and subsidized and regulated by the federal government.” There are about 1 million public housing units that are under contract with the federal government, meaning public housing is the second largest direct housing assistance program behind Section 8.
The Housing and Community Development Act of 1974 enacted the Community Development Block Grant (CDBG) program. Recipient communities must use at least 70% of funds for low- and moderate-income households, such as through property rehabilitation, services such as crime prevention or child care, or neighborhood economic development projects. Funding for CDBG has held steady at around $3.5 billion in recent years.
Congress
The following Congressional committees have jurisdiction over loans, mortgages, public and private housing, urban development, rural housing services, HUD, FHA, Fannie Mae and Freddie Mac, and financial institutions that influence the housing market, such as the Federal Home Loan Bank System:
- The House Committee on Financial Services, particularly the Subcommittee on Housing, Community Development, and Insurance
- The Senate Committee on Banking, Housing, and Urban Affairs, particularly the Subcommittees on:
- Housing, Transportation, and Community Development
- Financial Institutions and Consumer Protection Securities
- Insurance and Investment
State and Local Role
Housing is mainly regulated at the state and local levels. In the 1980s, many federal housing programs “had been scrapped as inefficient, subject to fraud and abuse, or too expensive,” and policymakers acknowledged that local communities might be able to provide housing more efficiently than HUD through the creation of block grants and tax credits.
The Tax Reform Act of 1986 provides Low-Income Housing Tax Credit (LIHTC) to state and local authorities to acquire, rehabilitate, or build new rental housing for lower-income earners. The proposed Middle-Income Housing Tax Credit (MIHTC) establishes a “public/private partnership that leverages federal dollars with private investment” for affordable rental housing for middle-income earners.
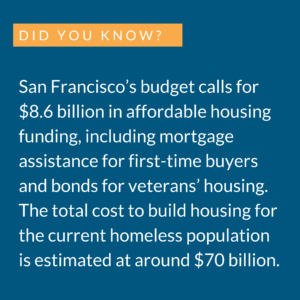
States and municipalities administer public housing and local rental assistance programs with funding through various sources. For example, San Francisco’s Direct Access to Housing Program deploys city and federal funds, whereas The San Francisco Housing First Program uses only city funds. See your state’s available programs, housing finance agency, and public housing authorities.
States also play a large role in homeless assistance programs. For example, while there are 33 federal programs “that explicitly flagged homeless individuals as beneficiaries,” federal funding works as part of a larger network. New York City spent $3.2 billion on homeless programs in 2019, and federal programs provided $134 million.
Finally, possibly the most influential role of the local government in the housing market is regulation in the form of zoning ordinances. These are regulations that govern how land can be used within the area. For example, zoning ordinances determine which areas are for residential buildings, which are for industrial buildings, and which are for commercial buildings. They also determine how close together buildings can be and the maximum height of buildings. Read on for more about zoning, or see The Policy Circle’s Stitching the Fabric of Neighborhoods Brief.
The Role of the Private Sector
The housing industry functions primarily by private enterprise. Banks fund mortgages and work with homeowners to prevent foreclosures. Private groups invest in building new housing and improving older housing through LIHTCs or other tax benefits like Opportunity Zones. Nonprofit groups such as NeighborWorks America, Habitat for Humanity, and Community Development Corporations revitalize and build in neighborhoods through options such as Community land trusts(discussed below).
Developed in the 1990s in response to homelessness, the Continuum of Care (CoC) Program “created local quasi-governmental entities in metropolitan areas that can apply for HUD funding and administer local homelessness programs.” The program is mostly managed by state and local governments, which distribute federal funding directly to CoC organizations that administer contracts to local shelters, housing programs, and service providers. The program distributed $2.65 billion for 6,597 local homeless housing and service programs across the U.S. and territories in FY2021. See grants for your state here.
Affordable housing extends beyond grant programs and vouchers to renters. In response to critics, HUD previously focused on leveraging private sector partnerships and encouraging more private investment in affordable housing. Some private nonprofit organizations are approved by HUD to participate in certain HUD programs in public-private partnerships.
Challenges and Areas for Reform
Affordable Housing
Housing prices are related to the cost of construction and the balance between supply and demand. Housing affordability is a qualitative measure reflecting the relationship between household incomes and housing prices. Affordability, labeled as “the greatest housing problem today,” stems from higher prices than incomes can afford. When prices are high, “the market is sending a message that housing is scarce and more is needed.”
The federal government’s main solutions include subsidies that lower cost burdens (such as rental assistance programs) and building more affordable housing units. Today, government housing policies prioritize subsidies. See Table 16 on page 39 of this Congressional Research Service report to see the increase in rental assistance and decrease in building housing, especially since 1990.
Rental assistance relies on contracts between building owners and HUD for affordable housing. When a contract expires, owners can charge market-rate rents, potentially making the units unaffordable for low-income families. Since more federal resources go towards subsidies than building new affordable units, “affordable housing preservation” is a major concern.
Additionally, “some landlords want to charge more than what the government thinks a particular unit is worth after checking it out.” According to Eva Rosen, assistant professor at Georgetown University, “landlords are often reluctant to get involved with the voucher program and in many places can simply refuse to rent to voucher holders.”
Some estimates indicate as many as 30% of families nationwide cannot use government vouchers. There are fifteen states and a few dozen cities with laws preventing this kind of discrimination. Still, landlords find loopholes, such as charging a higher rent than the government wants to pay or intentionally failing inspection reports.
Other suggestions include expanding the National Housing Trust Fund, which “provides grants to states to support the development and preservation of housing for households” with very or extremely low incomes. Grants are funded through fees on government-sponsored enterprise mortgages (from Fannie Mae and Freddie Mac), which amounted to $323 million in 2020. Advocates point to the self-funding mechanism and add that states have the flexibility to use the funds for several types of affordable housing expenses from preservations and rehabilitation to support services. Critics point out that the program is similar to many others, and that most housing programs are redundant and duplicative of each other.
Location is another important component, as individual municipalities make decisions related to land use and housing provision. For example, more than 10% of units within the city of Chicago are devoted to affordable housing, while fewer than 5% of units are in the city’s suburbs.
Demand for affordable housing and the cost of construction vary across the nation. In San Francisco, building affordable housing can cost three times as much as in Texas or Illinois due to the price of land and labor. The average construction costs are 13% higher than in New York, 60% higher than in Chicago, and 75% higher than in Houston. Many argue that California’s housing market is vastly over-regulated due to government fees and permits; a single affordable housing project often requires financing from an average of six different sources at the federal, state, and local levels.
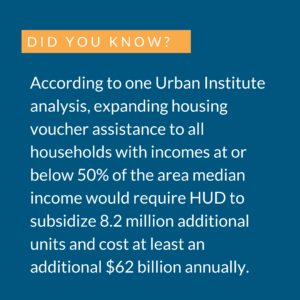
The coronavirus pandemic added to affordable housing complications. According to Harvard’s 2020 State of the Nation’s Housing report, one estimate from The Urban Institute projected “the cost of helping all renters return to their pre-pandemic income-to-rent ratio without unemployment assistance would be $5.5 billion per month, although even this support would leave many households with cost burdens.” A separate estimate from Harvard put the cost at $3.5 billion per month when paired with state unemployment support. Additionally, the pandemic caused construction costs to skyrocket due to supply shortages and demand increases for building supplies such as lumber.
The private sector also has a significant role to play. In 2019, several large tech companies committed to investing in affordable housing by offering grants to public agencies and local housing organizations. Alphabet’s Google committed $1 billion toward San Francisco Bay Area housing; Apple committed $2.5 billion throughout California; Microsoft, based in Washington, committed $750 million in Seattle; and Facebook committed $1 billion in Silicon Valley. Amazon committed over $2 billion in its hub cities of Seattle, Arlington, and Nashville. Critics maintain that “tech companies have played a role in driving up home prices by attracting well-paid workers who can pay more for housing than longtime residents.”
Another alternative is community land trusts, which “have the explicit goal of promoting affordable housing and contain legal provisions governing ownership and transfer to keep units affordable in perpetuity.” They are usually managed by a nonprofit, which owns the land and leases or sells the buildings to residents. Community members are often included on boards or in decision-making. Separating the cost of land from the cost of the building makes ownership more accessible to lower-income households. By one estimate, there are over 270 community land trusts nationally, from densely-populated urban areas like Houston, Texas, and Oakland, California, to more isolated mountain communities like Big Sky, Montana.
Gentrification
On the surface, gentrification looks like targeted investment in urban areas close to city centers to increase older home refurbishment, influx of new business, and updating land areas such as parks and community centers. However, investment in a distressed or low-income community can threaten property values and increase the cost of living to a point that pushes out the residents who have long lived in those communities.
This short video defines gentrification and explains both the positive and negative effects: Gentrification Explained.
One solution to counteract negative consequences of gentrification is to ensure local community partners have an ownership or equity stake in the investment. Locally led community development has a greater chance of success through shared ownership. The HUD Exchange provides funds via the Community Development Block Grant Programs. It comes with toolkits, training, and policy guidance for city leaders, investors, and community members to collaborate in community development.
Housing Finance
The U.S. housing finance system significantly influences the greater U.S. economy. Housing finance is primarily centered around mortgages – the debt homeowners incur with the purchase of a home. Most homebuyers do not have the financial resources available to outright purchase a home; most take out a loan or mortgage and agree to pay the loan incrementally over many years. A mortgage calculation involves more than just the borrowed value of the home and includes:
- Homeowners insurance
- Property taxes
- Mortgage insurance
In the primary mortgage market, when a borrower takes a loan from a lender, such as a bank or credit union, that bank or credit union services the loan. In the secondary mortgage market, investors purchase the loan, and sell it to another lender, who then processes the mortgage payments and makes money on fees and interest. Although this seems confusing to homeowners, the practice is common and ensures banks can continue to provide loans to other homebuyers, which furthers growth in the economy.
After the financial crisis, the federal government took steps to enhance consumer protections, leading to increased bank regulations. For example, the Dodd-Frank Wall Street Reform and Consumer Protection Act provides legal protections to lenders if their loans satisfy the requirements for qualified mortgage status. All loans guaranteed by federal agencies and purchased by Fannie Mae and Freddie Mac meet this criteria. Other originators – namely banks and credit unions – have limited themselves to only making qualified mortgage loans to avoid liability and risk. Note the difference in private securitization of the mortgage market compared to government mortgages before and after the financial crisis.
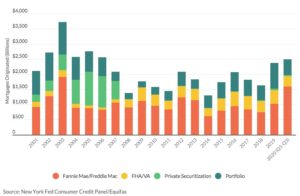
Because of the new rules, more private securitization firms exited the mortgage market. This added importance to government entities (note the increase in FHA/VA loans starting in 2008). This also applies to Fannie Mae and Freddie Mac, which are still under conservatorship as of early 2022 with no indication of an end to government control. This Marketplace podcast explains what this means.
Outside of mortgages, there are alternative financing arrangements “that research indicates are generally riskier, most costly, and subject to far weaker consumer protections and regulatory oversight than traditional mortgages.” Barriers to mortgages, such as the state of the housing market that resulted in a shortage of small mortgages, may be driving some borrowers to consider alternatives. Approximately 20% of home borrowers, about 36 million Americans, used alternative financing at least once, mostly those with annual household incomes under $50,000. Examples include:
- Seller-financed mortgages, when the seller also acts as the lender;
- Personal property loans, which typically have higher interest rates and shorter terms than comparable mortgages;
- Lease-purchase agreements, also known as “rent-to-own,” when the seller is also the landlord and the buyer occupies the property as a tenant, usually paying rent that exceeds the market rate in exchange for the option to purchase the home within a designated period.
Regulations for these types of finances vary by state, and the lack of consistency (and, in many cases, consumer protection) often leads buyers to pay higher costs and can result in default or loss of the home. Scarce information about the prevalence of alternative financing arrangements, including who uses them and why has generally prevented effective policymaking from protecting borrowers.
Homelessness
Founded in 1983, the main goal of the National Alliance to End Homelessness is to help provide permanent solutions for homeless individuals by offering “evidence-based approaches” to inform public policy addressing homelessness.
While affordability is a contributing factor to homelessness in America, the Discovery Institute’s Christopher Rufo adds the contributing factors of addiction, mental illness, and crime play critical roles as well. For example, a 2019 University of California Los Angeles report estimated that 75% of the unsheltered homeless population have a substance abuse disorder, 78% have a mental health disorder, and 84% have physical health conditions. Many support a “Treatment First” model where “the goal is to rehabilitate the individual, then secure permanent housing.” The alternative “Housing First” model provides housing without stipulations, failing to address conflating issues that contribute to homelessness.
The University of Alabama at Birmingham completed four randomized controlled studies of six-month programs that focused on a Treatment First model and “provided the homeless with abstinence-contingent housing and required participation in a rigorous full-time program of addiction recovery, behavioral treatment, work training, and recreational opportunities.” After six months, 64% of residents maintained sobriety and demonstrated housing stability and employment.
The National Alliance to End Homelessness suggests combinations, such as a coordinated systems approach designed to identify, assess, refer, and connect people in crisis to assistance, establish plans to help committees set goals and priorities, and focus on data collection to inform decisions. Similarly, permanent supportive housing can combine housing assistance with support services to build self-sufficiency by connecting people with “community-based health care, treatment and employment services.”
Los Angeles has worked to decrease its homeless veteran population by coordinating efforts with local agencies, advocacy groups, and the Department of Veterans Affairs. Homeless Providers Grant awards grants to community agencies “to help find short-term housing for veterans and deliver critical services to get their lives back on track,” marrying housing with “job training and services addressing mental health, substance abuse, and other issues.”
San Diego has also tried a similar strategy. Key & Kite media explains (6 min):
Zoning
Local governments set and enforce zoning ordinances that specify the purpose and use of land and which structures can be erected. This report from the Mercatus Center at George Mason University explains, “Exclusionary zoning includes rules that limit multifamily housing construction and mandate minimum lot sizes for single-family homes.”
Zoning laws such as land use restrictions and building codes can be essential to public health and safety. Development fees can be necessary for “schools, sewage systems, roads, and other public services associated with new development and growing populations.” Such regulatory requirements, density restrictions, and development fees “increase construction costs and limit the amount of new housing that can be built,” contributing to an undersupply of affordable housing.
The Institute for Humane Studies explains zoning (7 min):
Finding a balance is a top policy priority at the local level. Houston reduced its mandatory minimum lot size, making townhouse development possible. Minneapolis updated its zoning plan to allow duplexes and triplexes in areas of the city that were previously limited to single-family development. In the Louisville Metro area, the local government developed a website looking into zoning regulations to fully review and incorporate community feedback. Additionally, the Biden Administration has created an incentive for local governments that weaken exclusionary zoning laws. By decreasing the restrictions, cities are given greater preference for grants from the federal government.
Inclusionary Zoning
As opposed to exclusionary zoning, inclusionary zoning policies “require or incentivize developers to designate a portion of new housing units as affordable for households making low or moderate incomes in exchange for density bonuses, allowing developers to build more market-rate housing than they would otherwise be allowed.”
The density bonuses’ values depend on housing prices and how much zoning restricts development in a particular area. According to Emily Hamilton at the Mercatus Center, density bonuses will be valuable where zoning is restrictive, and housing prices are high. In areas where developers are not as limited and can provide as much housing as is profitable, bonuses have less value and “inclusionary zoning programs will be a clear tax on construction.”
Advocates say inclusionary policies produce affordable housing without spending tax dollars. Critics say it’s a go-around that does nothing to address the exclusionary zoning that leads to high housing prices in the first place. For more on zoning, see The Policy Circle’s Stitching the Fabric of Neighborhoods Brief.
PBS dives into how zoning can restrict and even prevent affordable housing (11 min):
The Manhattan Institute studied participants in local zoning board meetings and found that those who oppose new construction projects were most vocal, even when local consensus favored a project. The phenomenon known as “Not In My Backyard” (NIMBY) describes a general attitude towards new development – any development – of total opposition driven by fears of corporate overtake, decrease in home value, or environmental degradation. NIMBY is nonpartisan and only biased to or against personal and community interests.
Conclusion
The Housing Act of 1949 established the goal of “a decent home and a suitable living environment for every American family.” However, the complexity and instability of the financial market, and the question of government oversight, raise the question of whether or not all Americans can afford to own homes and what the future of homeownership looks like.
Homes are not only the dwelling we live in; they are key components of the livelihood of neighborhoods, deeply intertwined with the surrounding communities and existing amenities. Michael Hendrix recently contends policymakers need to consider all of the contributing factors that influence where and why people move, not just the high cost of housing.
One question policymakers must ask is this: if we can establish that homeownership is less attainable to not only Gen Z and Millennials but middle-income earners as well, is the market sustainable? Whether their reasoning is out of personal choice or lack of affordability, the long-term effects on the market and U.S. industry will be significant.
Thought Leaders and Additional Resources
Christopher Rufo, The Discovery Institute
Michale Hendrix, Manhattan Institute, How to Fight Housing Price InflationPolicy Menus for Stopping Government-Induced Housing Woes from Spreading Beyond the Coasts
Emily Hamilton, Mercatus Center
Harvard’s 2020 State of the Nation’s Housing Report
HUD’s 2020 Annual Homeless Assessment Report
Housing Issues in the 116th Congress
End Homelessness: Tracking relevant legislation
State Policy Network’s State & Local Zoning Reform Toolkit
HUD Office of Housing Counseling Resources
PolicyMap Housing Needs Assessment Report
National Low Income Housing Coalition: How much do you need to earn to afford a modest apartment in your state?
Ways to Get Involved/What You Can Do
Measure: Find out what your state and district are doing about affordable housing and homelessness.
- Do you know the state of the rental and housing market in your community or state?
- How much do you need to earn to afford a modest apartment in your state?
- What are your local zoning laws?
- How much was your state or community granted in housing-related funding?
- Is there a coalition or task force related to homelessness, or does one need to be formed?
Identify: Who are the influencers in your state, county, or community? Learn about their priorities and consider how to contact them, including elected officials, attorneys general, law enforcement, boards of education, city councils, journalists, media outlets, community organizations, and local businesses.
- Who are the members of departments related to housing and housing finance in your state?
- Who is in charge of your Local Public Housing Agency (PHA) or State Housing Finance Agency (HFA).
- What steps have your state or community elected and appointed officials taken?
Reach out: You are a catalyst. Finding a common cause is a great opportunity to develop relationships with people who may be outside of your immediate network. All it takes is a small team of two or three people to set a path for real improvement. The Policy Circle is your platform to convene with experts you want to hear from.
- Find allies in your community or in nearby towns and elsewhere in the state.
- Foster collaborative relationships with law enforcement, first responders, faith-based organizations, local hospitals, community organizations, school boards, local real estate agents, and local businesses.
Plan: Set some milestones based on your state’s legislative calendar.
- Don’t hesitate to contact The Policy Circle team, communications@thepolicycircle.org, for connections to the broader network, advice, insights on how to build rapport with policy makers and establish yourself as a civic leader.
Execute: Give it your best shot. You can:
- Ask policymakers about local housing strategy.
- What are the objectives? How will they be met and over what time frame? How will they be assessed to ensure accountability and transparency?
- Contact local real estate agents to understand key challenges in the housing market.
- If you are unfamiliar with the housing market, talk to your friends and neighbors about their experiences renting or purchasing a home.
- Learn from local business owners about whether and how local zoning ordinances affect them and their businesses.
- Investigate volunteer opportunities, such as with Habitat for Humanity or NeighborWorks,
Working with others, you may create something great for your community. Here are some tools to learn how to contact your representatives and write an op-ed.
Suggestions for your Next Conversation
Explore the Series
This brief is part of a series of recommended conversations designed for circle's wishing to pursue a specific focus for the year. Each series recommends "5" briefs to provide a year of conversations.